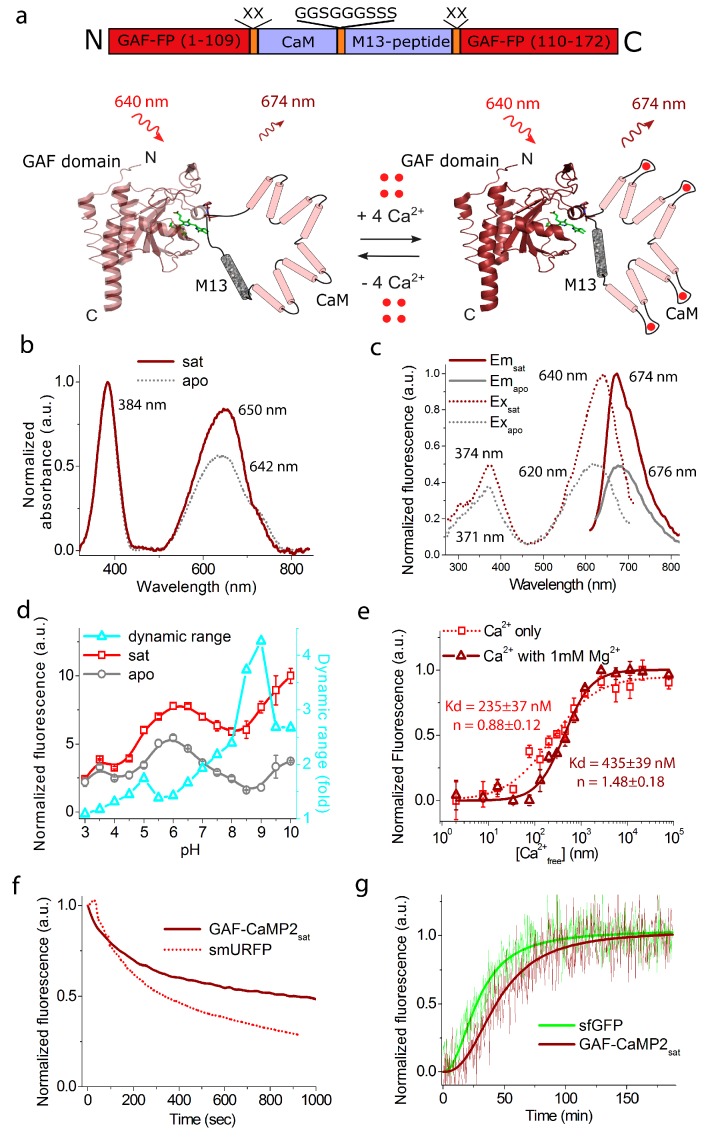
Figure 3.
In vitro properties of the purified GAF-CaMP2 indicator. (a) A scheme of the original library for optimization of linkers in the GAF-CaMP2 indicator and suggested mechanism of its function based on the crystal structure of GAF domain (PDB 3C2W). The BV chromophore is highlighted in green. (b) Absorbance spectra for GAF-CaMP2 in Ca2+-bound and Ca2+-free state at pH 7.2. (c) Excitation and emission spectra for GAF-CaMP2 in Ca2+-bound and Ca2+-free states, pH 7.2. (d) Fluorescence intensity for GAF-CaMP2 in Ca2+-bound and Ca2+-free states as a function of pH. Three replicates were averaged for analysis. Error bars represent the standard deviation. (e) Ca2+ titration curves for GAF-CaMP2 in the absence and in the presence of 1 mM MgCl2, pH 7.2. Three replicates were averaged for analysis. Error bars represent the standard deviation. (f) Photobleaching curves for GAF-CaMP2 in Ca2+-bound state and smURFP. The power of light before the objective lens was 2.23 mW/cm2. Four replicates were averaged for analysis. (g) Maturation of purified GAF-CaMP2-sfGFPsat fusion protein. The experimental data were fitted by the Hill equation. Protein maturation occurred in Ca2+-saturated buffer 30 mM HEPES, pH 7.20, 100 mM KCl, 1 µM BV, 5 mM Ca-EDTA at 37°C. The green (ex. 460/10 nm, em. 520/10 nm) and far-red (ex. 640/10 nm, em. 675/10 nm) fluorescence were simultaneously registered for sfGFP and GAF-CaMP2sat in their fusion, respectively.

