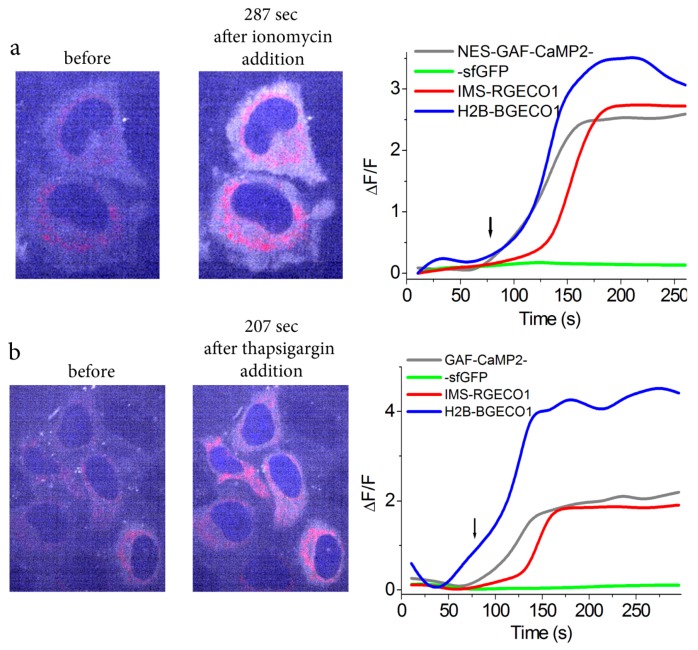
Figure 6.
Visualization of calcium transients in three organelles of mammalian cells using GAF-CaMP2 indicator and four-color fluorescence confocal microscopy. Confocal images of HeLa Kyoto cells co-expressing blue H2B-B-GECO1, green/far-red NES-GAF-CaMP2-sfGFP, and red IMS-R-GECO1 calcium indicators in the nucleus, cytosol, and intermembrane space of mitochondria, respectively, before and respective time after addition of the 2.5 µM ionomycin (a) or 10 µM thapsigargin (b). Overlap images of blue (in blue, ex. 405 nm, em. 447/60 nm), red (in red, ex. 561 nm, em. 617/73 nm), and far-red (in grey, ex. 640 nm, em. 685/40 nm) channels are shown; the green (ex. 488 nm, em. 525/50 nm) channel is intentionally missed. The graphs illustrate ΔF/F changes in all fluorescence channels for respective indicators. Example of one cell is shown. The time of ionomycin and thapsigargin addition is shown by the arrow. A total of 20 µM BV was supplied during the cell’s transfection procedure 24–48 h before imaging.

