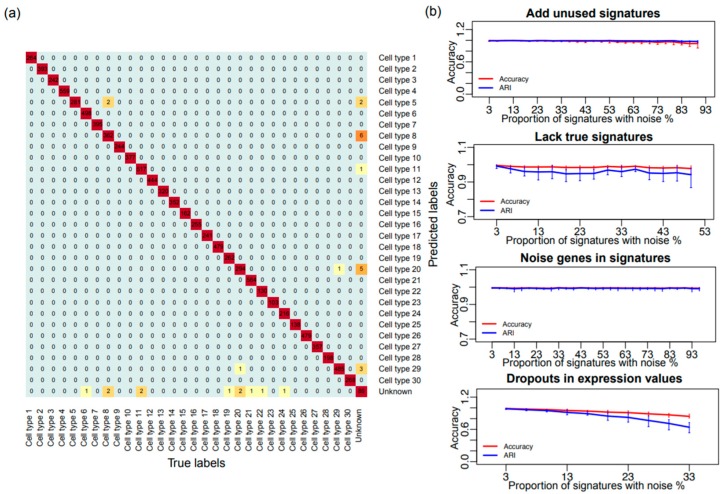
Figure 2.
Performance of SCINA on simulated data. (a) Heatmap showing the overlap between the simulated cell types and the detected cell types by SCINA. (b) Challenging the SCINA algorithm by adding different types of noise: additional signatures for non-existent cell types, lack of true signatures for existing cell types, extra irrelevant genes in signatures, and simulated gene expression dropouts. Each scenario was repeated 10 times, and each repeat was performed on a newly-simulated matrix of 4000 cells. Performance is judged by Adjusted Random Index (ARI) and percentage of cells correctly assigned (ACC).

