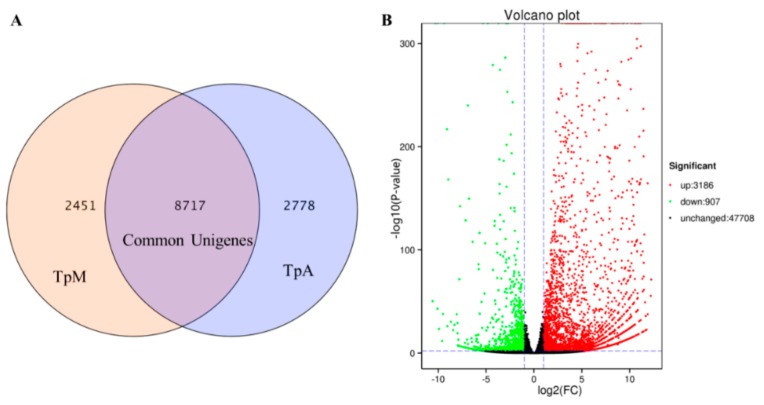
Figure 2.
Distribution of expressed unigenes in the larval and adult stages of T. pisiformis: (A) The commonly or specifically expressed unigenes and (B) volcano plots of differentially expressed genes (DEGs) in TpA versus TpM. Unigenes with |log2FC| > 1 and adjusted p-value ≤ 0.01 were considered differentially expressed. Black splashes indicate genes with no significant change, and red and green splashes represent significantly upregulated and downregulated genes, respectively.

