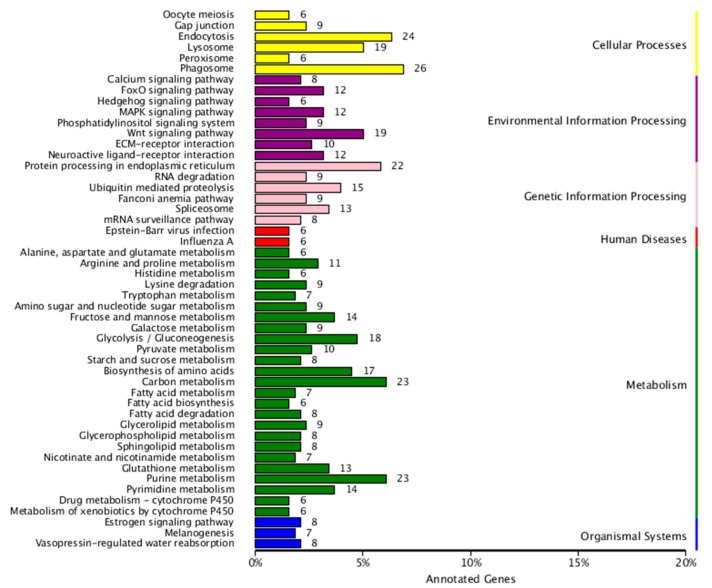
Figure 4.
The enriched KEGG pathways of DEGs in TpA versus TpM: The numbers at the right of each column indicate the number of DEGs included in the corresponding pathway. The pathways were divided into six categories: “cellular processes”, “environmental information processes”, “genetic information processes”, “metabolism”, “human diseases,” and “organismal systems”. Criteria for statistical significance was p-value < 0.05.

