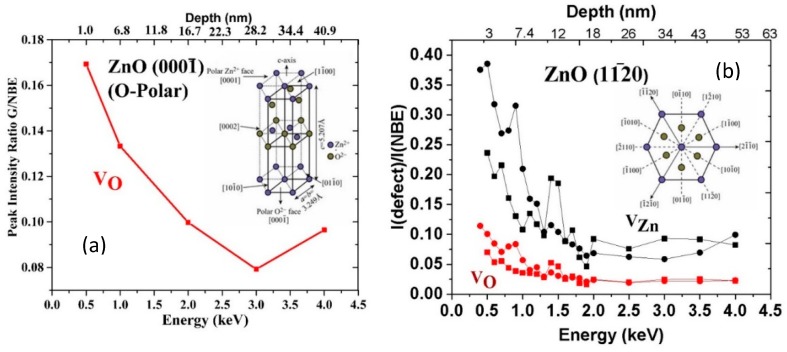
Figure 7.
Defect segregation below a ZnO single crystal free surface versus crystal orientation. (a) [000] VO (2.5 eV) and (b) [110] VZn (1.7–2.1 eV) and VO (2.4–2.5 eV) segregation. Higher VO segregation in O- vs. Zn-polar ZnO also shown in ([52]) Reprinted with permission by American Institute of Physics Refs. ([51,52,53], respectively).

