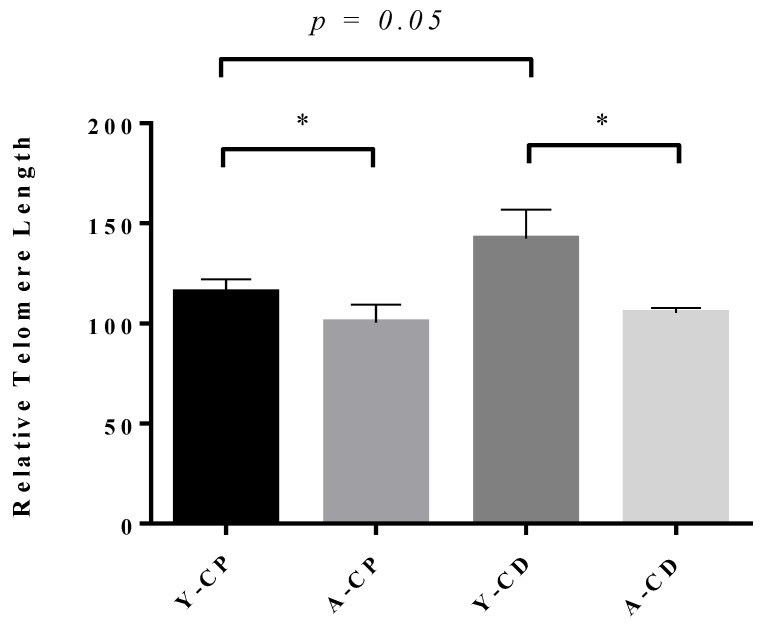
Figure 2.
Telomere length for Brown Norway sperm during aging. Relative telomere length (rTL) shown on the y-axis measured by quantitative polymerase chain reaction (qPCR) relative to H1301 cell DNA of a known telomere length, for young caput sperm (Y-CP; n = 5), aged caput sperm (A-CP; n = 4), young cauda sperm (Y-CD; n = 5), and aged cauda sperm (A-CD; n = 4). Each bar represents the mean ± SEM. p ≤ 0.05 is indicated by an asterisk. Sprague Dawley data shown in Figure A1.

