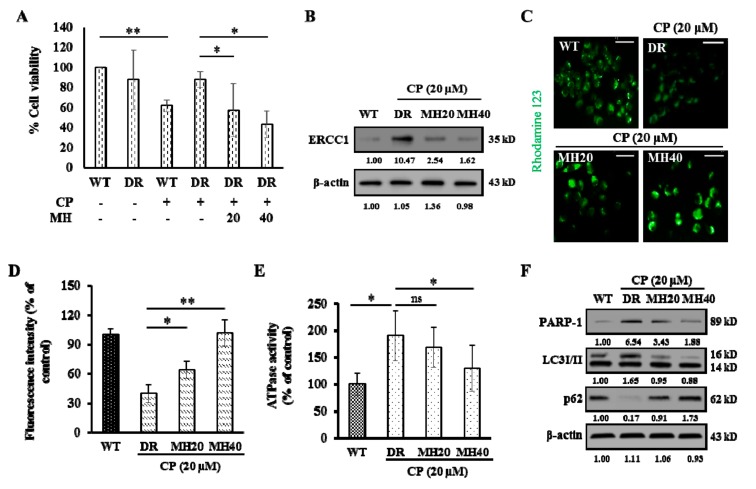
Figure 1.
Morin hydrate (MH) reverses cisplatin (CP) resistance of HepG2DR cells. (A) Cell viability of HepG2WTand HepG2DR cells was measured after CP and CP-MH treatment by the MTT assay. (B) Western blot analysis of excision repair cross-complementation group 1 (ERCC1) expression in HepG2DR cells as a marker of developing CP resistance; ERCC1 levels were normalized to those of β-actin. (C) Fluorescent micrograph of rhodamine-123 intracellular accumulation in HepG2DR cells using an ATP-binding cassette sub-family B member 1 (ABCB1 or P-gp) activity assay after 24 h of corresponding drug treatment (magnification: 200×; scale bar: 0.1 mm). (D) Fluorescence intensity calculated using the ImageJ software. (E) ATPase activity of HepG2DR cells after 24 h of CP-MH treatment. (F) Expression levels of poly(ADP-ribose) polymerase 1 (PARP1), LC3I/II, and p62 in HepG2DR cells were analyzed by Western blotting; results were normalized relative to β-actin. Relative intensities were measured by ImageJ software. Data are presented as the means ± standard deviation (SD) (n = 3). * p < 0.05, ** p < 0.01. DR = drug resistant; WT = wild type.

