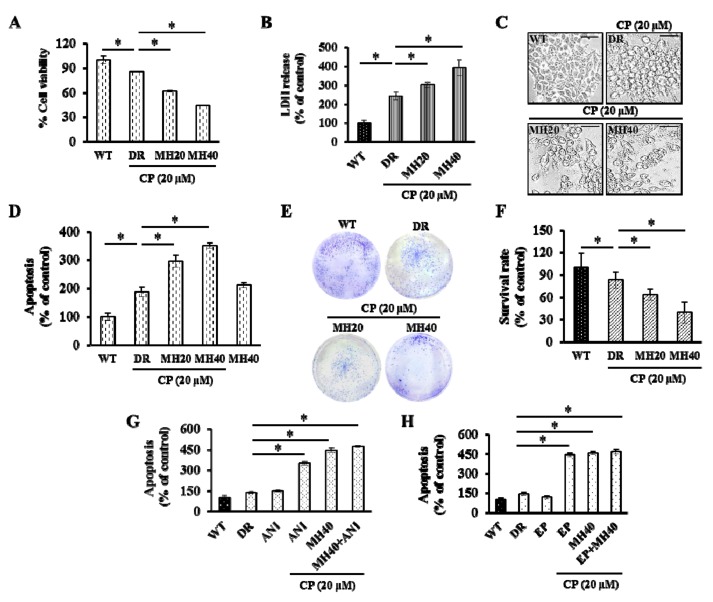
Figure 4.
MH promotes apoptosis of HepG2DR cells against CP. (A) HepG2DR cell viability was measured after drug treatment by the MTT assay. (B) Total cellular LDH release was measured by the LDH assay. (C) Representative microscopic images of the morphology of HepG2WT and HepG2DR cells after drug treatments (magnification: 200×; scale bar: 0.1 mm). (D) Percentage of apoptotic HepG2DR cells was determined by the apoptosis assay. (E) HepG2DR cell proliferation was evaluated by the colony formation assay. (F) The colony survival rate was calculated using the ImageJ software. (G,H) The apoptosis assay with HepG2DR cells was performed after 24 h of treatment with the indicated concentrations of CP in the presence or absence of ANI (10 μM), ethyl pyruvate (EP) (20 mM), and MH (40 μM), using the ApoStrand™ ELISA apoptosis detection kit. Data are presented as the means ± SD (n = 3). * p < 0.05, ** p < 0.01.

