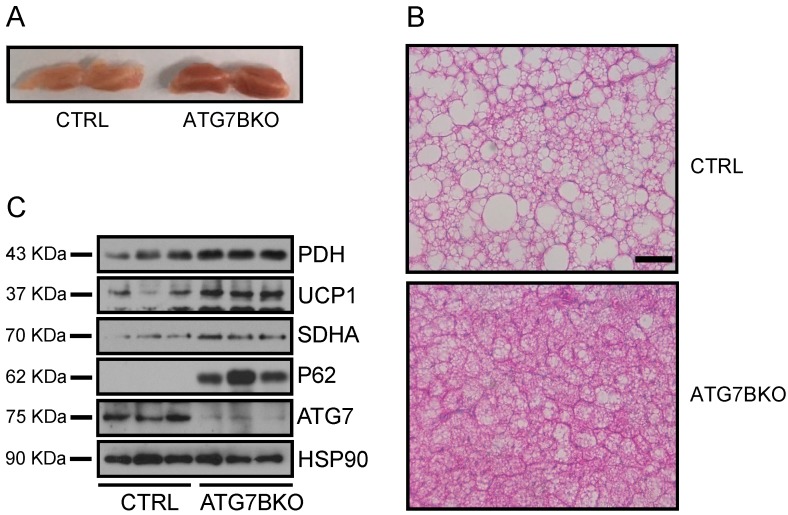
Figure 4.
Increased mitochondrial content in ATG7B KO mice. (A). Appearance of BAT depots dissected from control and ATG7B KO mice. (B). Histological analysis of hematoxylin and eosin (H & E) stained sections of BAT from control and ATG7B KO mice. The scale bar represents 200 μm. (C). Immunoblotting for UCP1 and mitochondria-resident proteins PDH and SDHA in BAT depots of control and ATG7B KO mice.

