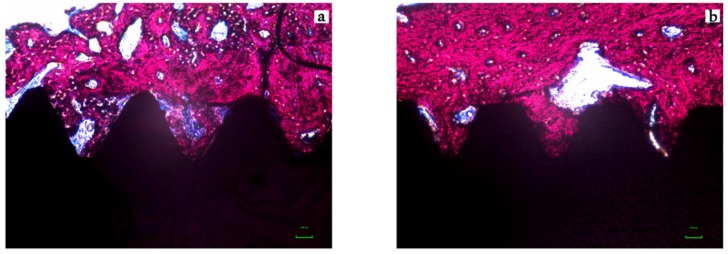
Figure 6.
Photomicrograph of the micro-implants and surrounding tissues for the Control (A) and Test (B) groups in magnification of 200× (Stevenels’ Blue) for two weeks (T1). Bone mineralized tissue stained in pink, non-mineralized tissue stained in white/blue and titanium in black. Note that the level of bone to implant contact and the bone area occupied between the implants’ threads are higher in the test group.

