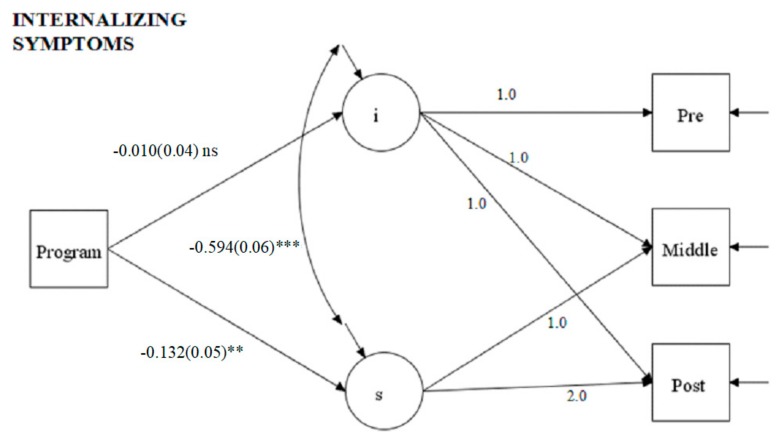
Figure 1.
Effects of the program on Internalizing Symptoms growth curves. MODEL FIT: χ² = 0.773; df = 3; p = 0.00; comparative fit index (CFI) = 1.000; root mean squared error of approximation (RMSEA) = 0.00. Note: The path coefficients and standard errors (in brackets) are standardized esteems (** for p < 0.01; *** for p < 0.001). Legend: “S” stands for internalizing symptoms slope and “I” stands for internalizing symptoms intercept.

