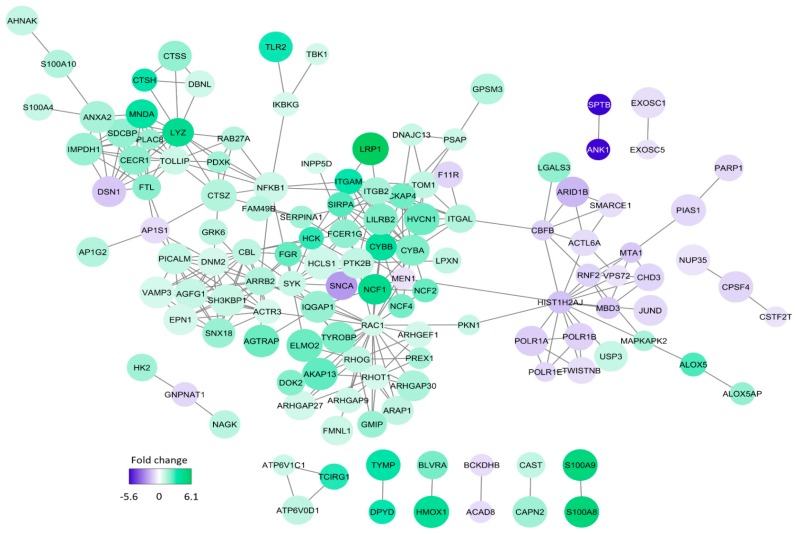
Figure 5.
The network analysis of proteins showing differential expression in primary AML cells with generally high versus generally low constitutive release of extracellular mediators. The intensity of the color reflects the fold change (FC) significance when comparing the high- and low-release groups; thus a negative fold change indicates increased protein abundance in the low-release group (purple) and a positive fold change indicates increased protein abundance in the high-release group (green). This STRING-DB analysis was based only on the 256 proteins that were quantified and considered significantly different between the two groups; the figure thus shows proteins from our quantified data and no shells of interactors were considered.

