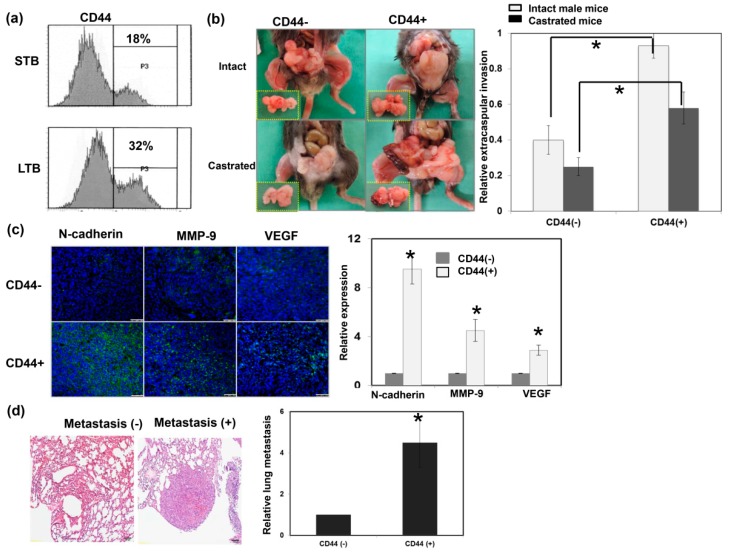
Figure 3.
Role of CD44 in tumor aggressiveness. (a) The levels of CD44 were evaluated by fluorescence-activated cell sorting (FACS) for cancer cells of LTB compared to those of STB. (b) The invasive capacity was evaluated using orthotopic tumor model. The representative slides and quantitative data are shown. The Y-axis represents the ratio of mice presenting extracapsular extension normalized to that received orthotopic tumor implantation. Data points represent the means ± SEMs. *, p < 0.05. (c) Expressions of EMT-related proteins were examined by immunofluorescence (IF) in vitro (DAPI, blue; N-cadherin/VEGF/MMP-9, green). Scale bars: 50 μm. The quantification is to calculate the value of the cell number positive for targeted protein divided by the total cell number. The Y-axis represents the ratio normalized by the value of CD44 (−) cells. (d) Lung metastasis was determined by cells injected into mice via the tail vein and metastasis assayed. The representative slides and quantitative data are shown. *, p < 0.05.

