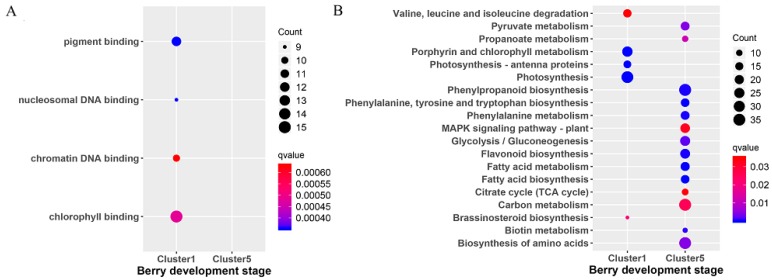
Figure 3.
Scattergram of both Gene Ontology (GO) enrichment analysis and Kyoto Encyclopedia of Genes and Genomes (KEGG) pathways analysis. (A) GO enrichment analysis. The X-axis indicates the berry development stages; the Y-axis indicates the GO terms. (B) KEGG pathway analysis. The X-axis indicates the berry development stages; the Y-axis indicates the KEGG pathway. Coloring indicates q-value, with higher values in red and lower values in blue, and the lower q-value indicates genes that are more significantly enriched. Point size indicates genes number.

