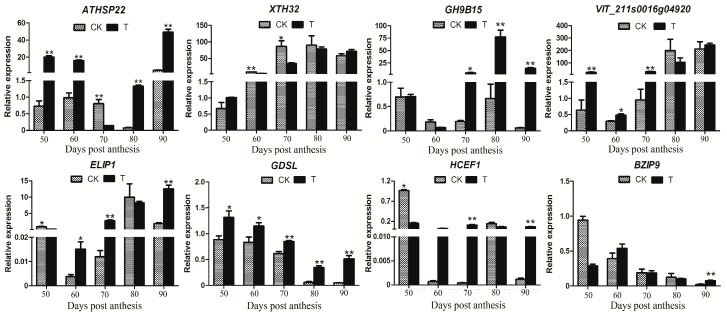
Figure 9.
qRT-PCR expression patterns of both six DEGs and two hub genes detected in the RNA-Seq profiles of the control and the treatment. The X-axis represents the berry development stages; the Y-axis represents the relative level of expression. Three biological replicates are used for qRT-PCR validation. Significant differences between means were made using ANOVA. The asterisk (*) stands for the levels of significant difference (p value ≤ 0.05).

