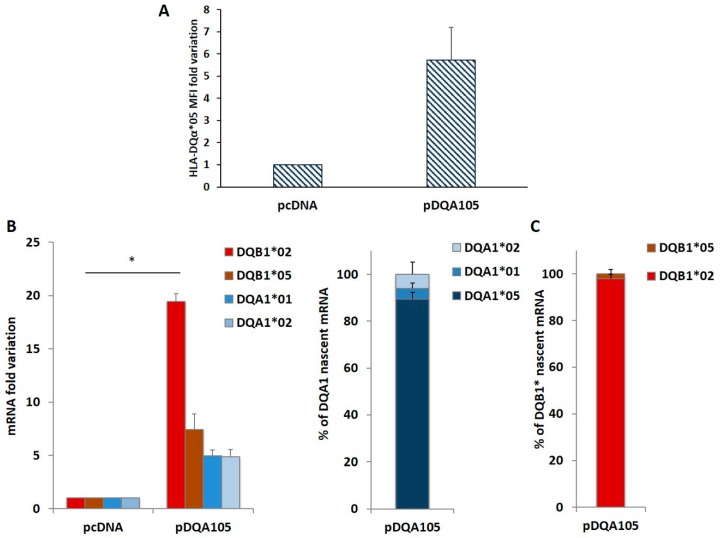
Figure 3.
Coregulated expression of DQA1*05 and DQB1*02 CD risk alleles in DR7/DR14 B-LCL and nascent RNA. This cell line was transfected with pcDNA and pDQA105 constructs. In panel A we show the MFI assessed by flow cytometry. Panel B reports the fold variation of endogenous DQA1*01, DQA1*02, DQB1*02 and DQB1*05 mRNA. P value was calculated respect to cells transfected with empty vector (* p < 0.05). Panel C shows the quantity of nascent endogenous mRNA following pDQA105 transfection. The left histogram shows the ectopic DQA1*05 mRNA in addition to the endogenous DQA1*01 and DQA1*02 mRNA, as percentage of total DQA1 transcript. The right histogram reported the amount of nascent endogenous DQB1*02 and DQB1*05 mRNA as percentage of total DQB1 transcript.

