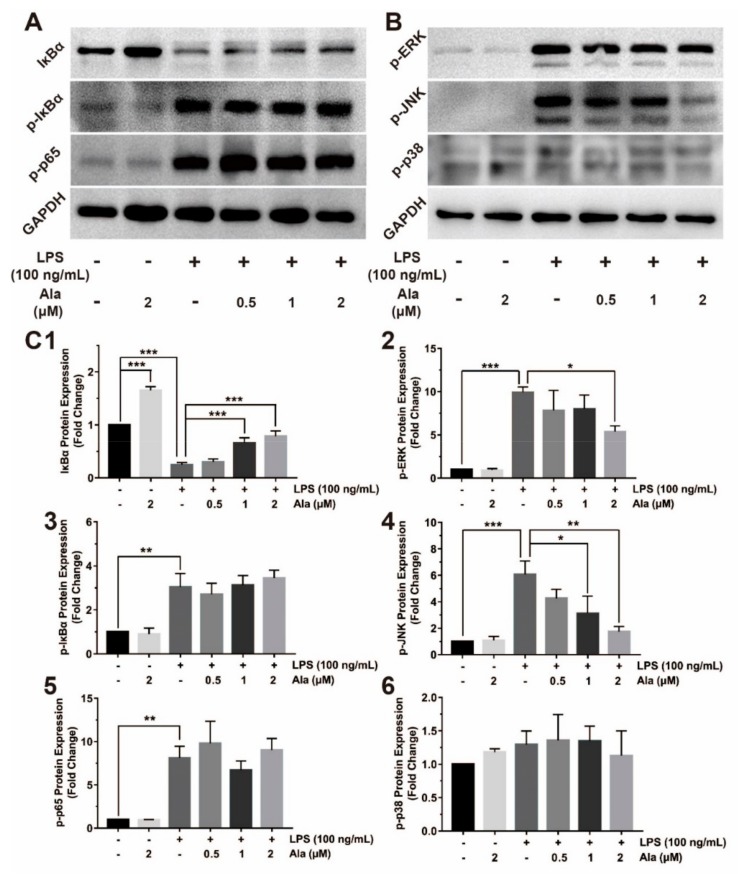
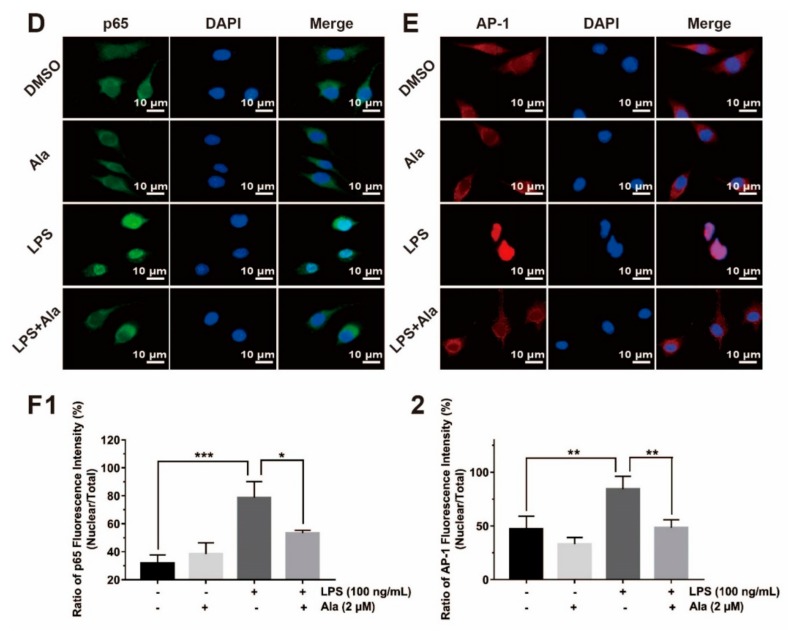
Figure 4.
Effect of Ala on NF-κB and MAPK signaling pathways. The BV2 cells were pretreated with Ala for 30 min and stimulated with LPS for another 1 h. (A) NF-κB detection with anti-IκBα, anti-p-IκBα, and anti-p-p65 antibodies. (B) MAPK detection with anti-p-ERK, anti-p-JNK, and anti-p-p38 antibodies. (C) Band intensities of (1) IκBα, (2) p-ERK, (3) p-IκBα, (4) p-JNK, (5) p-p65, and (6) p-p38 were quantified using Image J software. (D) Immunofluorescence of anti-p65 antibody for detection of translocation to the nucleus. The green fluorescence represents p65, and the blue fluorescence represents DAPI. (E) Immunofluorescence of the anti-AP-1 antibody for detection of translocation to the nucleus. The red fluorescence represents AP-1, and the blue fluorescence represents DAPI. (F) Fluorescence intensities of p65 and AP-1 were quantified using Image J software. The concentration of LPS in (D,E) is 100 ng/mL. The concentration of Ala in (D,E) is 2 μM. (n = 3) (* p < 0.05) (** p < 0.01) (*** p < 0.001).


