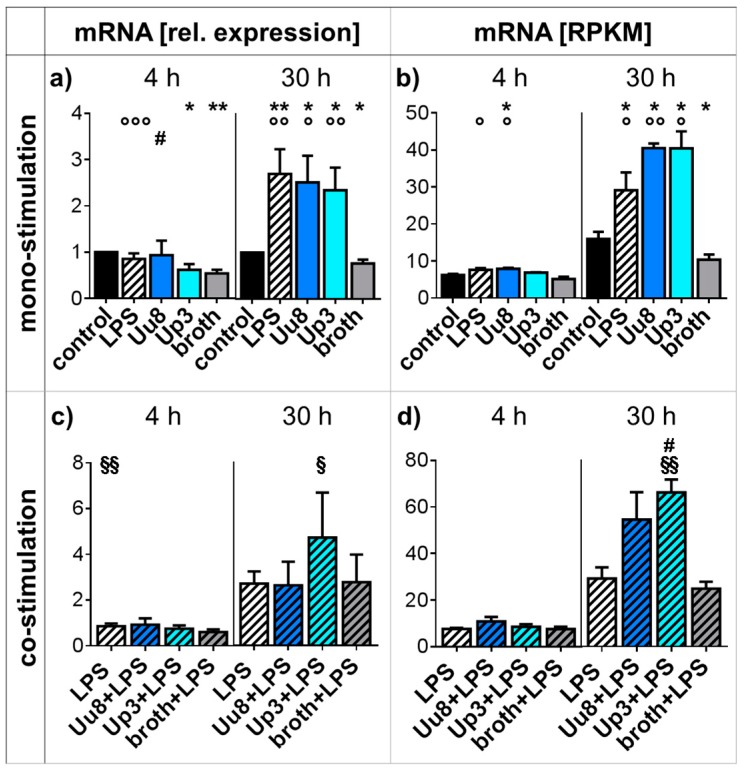
Figure 3.
CXCR4 responses in mono- and co-stimulated HBMEC. CXCR4 mRNA levels in mono-stimulated cells were assessed by qRT-PCR (a) and RNA sequencing (b). In co-stimulated HBMEC, qRT-PCR (c) and RNA sequencing (d) were used to determine CXCR4 mRNA levels. Data are presented as means ± SD and were obtained from n ≥ 3 independent experiments (* p < 0.05, ** p < 0.01 vs. unstimulated control; ° p < 0.05, °° p < 0.01, °°° p < 0.001 vs. broth; # p < 0.05 vs. LPS; § p < 0.05, §§ p < 0.01 vs. broth+LPS). CXCR: C-X-C chemokine receptor; HBMEC: human brain microvascular endothelial cells; LPS: lipopolysaccharide; RPKM: reads per kilo base per million mapped reads; SD: standard deviation; Up3: Ureaplasma parvum serovar 3; Uu8: Ureaplasma urealyticum serovar 8.

