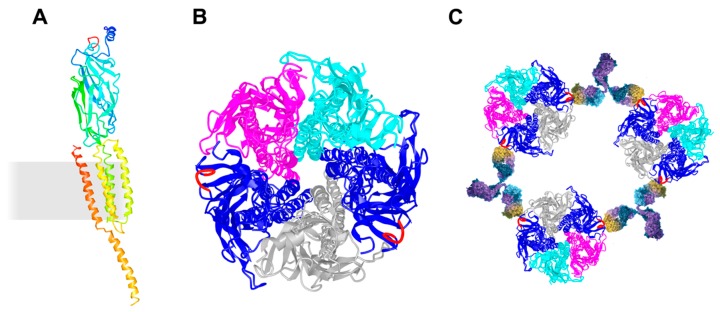
Figure 1.
Schematic presentation of the AChR and its cross-linking via the MIR. (A) Ribbon diagram of a single AChR α subunit viewed in an orientation such that the central axis of the pentamer is to the side (right). The membrane is indicated as a grey rectangle. α-helices M1–M4 are membrane-spanning and form the ion-permeable gate of the AChR. The MIR (shown in red) is located between β2- and β3-strands. (B) Ribbon diagram of the whole receptor viewed from the synaptic cleft. AChR α in blue with the MIR in red, AChR β in magenta, AChR δ in cyan, and AChR γ in grey. The MIR is shown in red. (C) Schematic presentation of autoantibody-induced inter-molecular cross-linking via the MIR. The molecular models were drawn using the molecular coordinates from the density maps deposited in the Protein Data Bank (PDB file accession number 3BG9 [112]) and the Web-based 3D Structure Viewer iCn3D.

