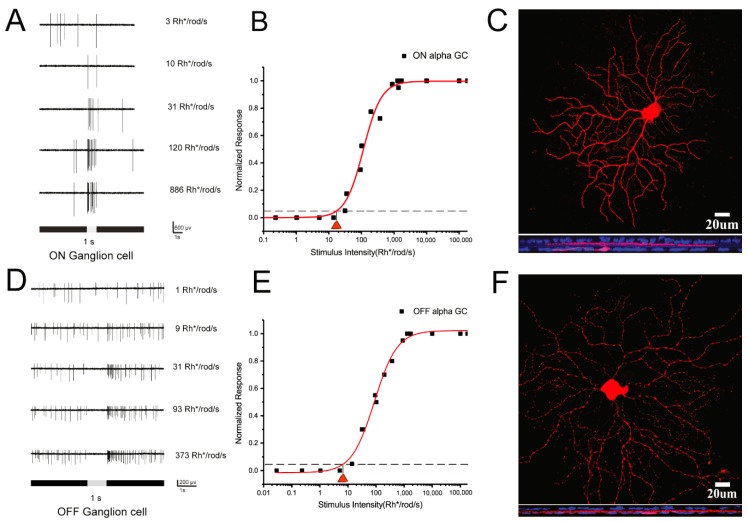
Figure 1.
Dark-adapted ON and OFF α-RGCs show low-intermediate light threshold sensitivities. A and D; ON and OFF RGCs show increasing spikes to full-field 525 nm light stimuli of increasing intensities. B and E; Intensity–response function of the ON and OFFα-RGC, showing a threshold sensitivity of around 10 Rh* /rod/s. C and F; ON and OFFα-RGCs can be visualized by Neurobiotin injection after recording. Double labeled with anti-ChAT antibody (blue). Scale bar = 20 µm.

