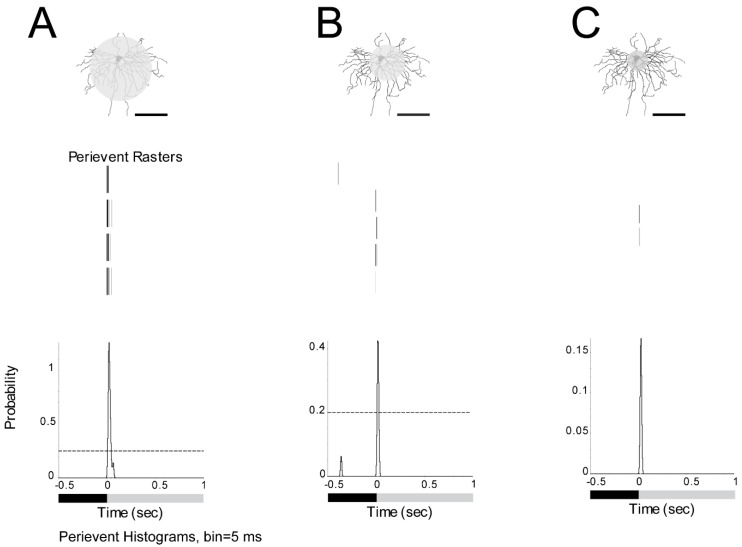
Figure 3.
Dark-adapted ON α-RGCs show decreasing spikes to smaller light spot stimuli. A: ON α-RGC response to a 125 µm light spot. B: The peristimulus time histogram shows the decreased probability of spikes to a 75 µm light spot. C: The peristimulus time histogram shows that the cell almost lost the light response to a 50 µm light spot. Therefore, a 125 µm light spot was used in the subsequent experiments. (1 s light stimulation). Scale bar: 75 µm.

