Figure 4.
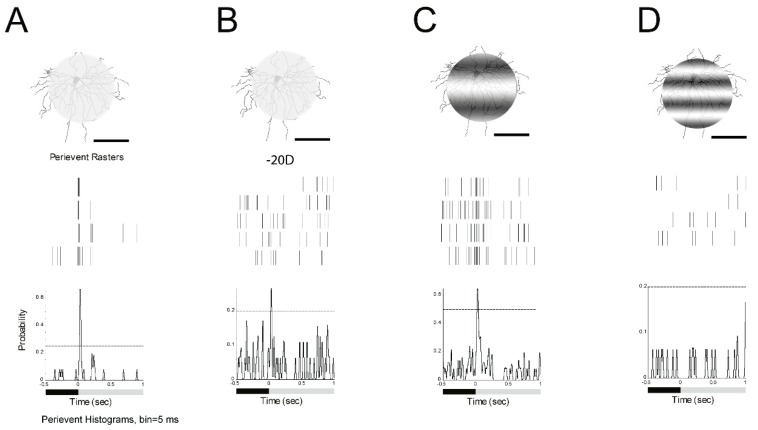
Defocused images and different spatial frequencies can both change the signaling of α-RGCs. A: ON α-RGC response to 1 s 125 µm, 0 cycles/degree light spot. Light stimulus (I = 1.665 × 10⁵ Rh*/rod/sec). B: ON α-RGC response to 1 s 125 µm, 0 cycles/degree light spot while defocus under microscopy to -20D. The peristimulus time histogram of the ON α-RGC showed that the probability of spikes decreased from 0.65 to 0.25; 95% confidence limits for the conditions are similar. C: Peristimulus time histogram of the ON α-RGC response to 1 s 125 µm, 0.002 cycles/degree light showed that the probability of spikes decreased from 0.65 to 0.62. However, 95% confidence limits are similarly increased from 0.25 to 0.5. D: ON α-RGCs lost their light response to 1 s 125 µm, 0.0067 cycles/degree light stimulation. Scale bar: 75 µm.

