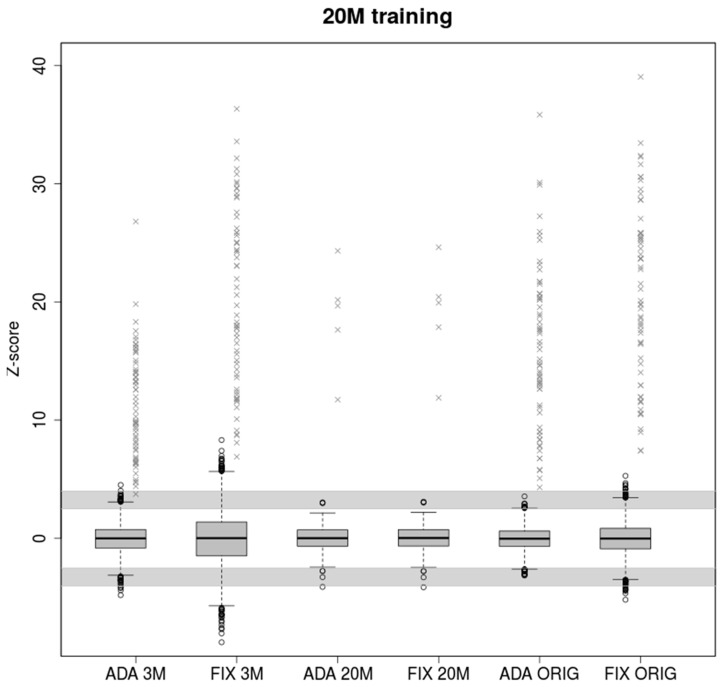
Figure 2.
Boxplots of euploid NIPT samples for ADAVAR and FIXVAR models trained with samples subsampled to 20M reads uniquely mapped to autosomes. Models have been tested with equivalent samples subsampled to 3M (ADA 3M, FIX 3M) and 20M (ADA 20M, FIX 20M) respectively and with original read count of reads uniquely mapped to autosomes (ADA ORIG, FIX ORIG). Grey crosses represent trisomic samples. The grey areas defined by ranges (2.5, 4) and (−4, −2.5) represents uninformative calls.

