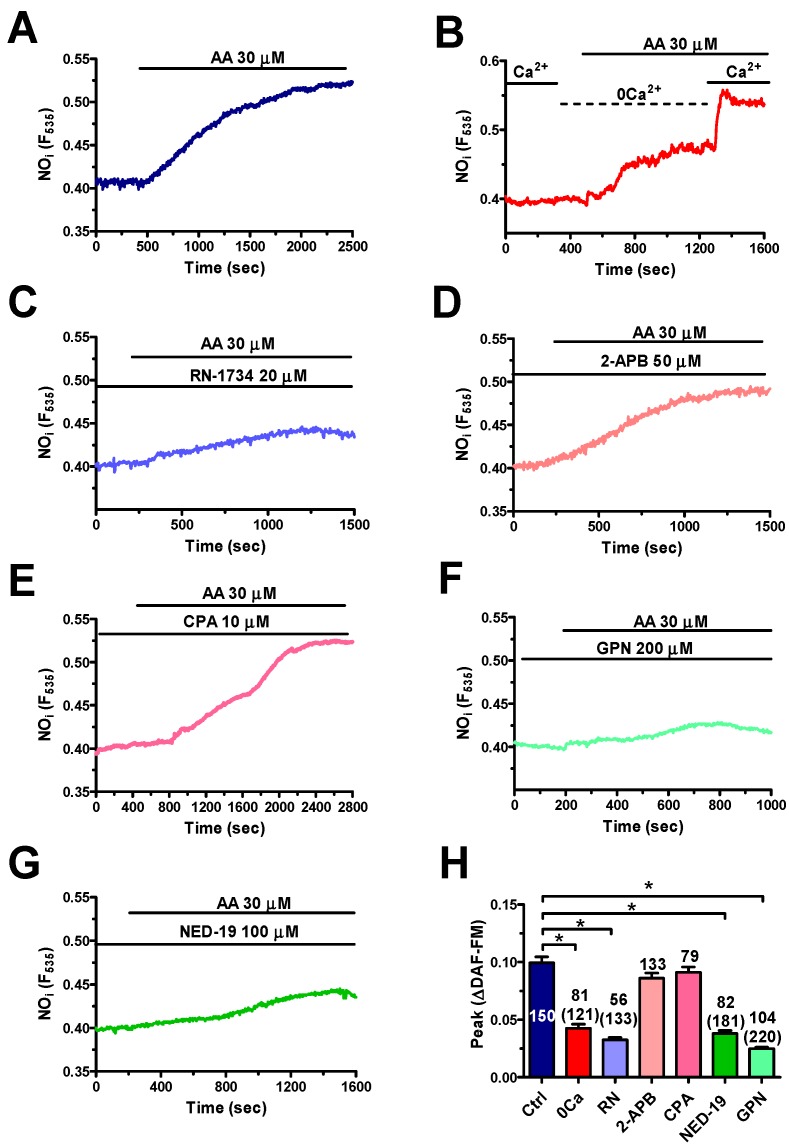
Figure 8.
TPC1-2 and TRPV4 support arachidonic acid-induced NO production in hCMEC/D3 cells. (A) AA (30 μM) evoked robust NO release under control conditions in hCMEC/D3 cells. (B) AA (30 μM) induced NO release under 0Ca2+ conditions, although this signal was lower as compared to control conditions. However, readdition of Ca2+ to the perfusate caused a second increase in DAF-FM fluorescence. (C) RN-1734 (20 μM, 20 min) reduced AA-evoked NO release. AA was administered at 30 μM. (D) 2-APB (50 μM, 30 min) did not affect AA-induced NO production. AA was administered at 30 μM. (E) CPA (10 μM, 30 min) did not impair AA-evoked NO release. AA was administered at 30 μM. (F) GPN (200 μM, 30 min) remarkably reduced AA-induced NO production. AA was administered at 30 μM. (G) NED-19 (100 μM, 30 min) impaired AA-evoked NO release. AA was administered at 30 μM. (H) Mean ± SE of the amplitude of AA-evoked NO release under the designated treatments. The asterisk indicates p < 0.05. The total number of analysed cells is indicated in the brackets.

