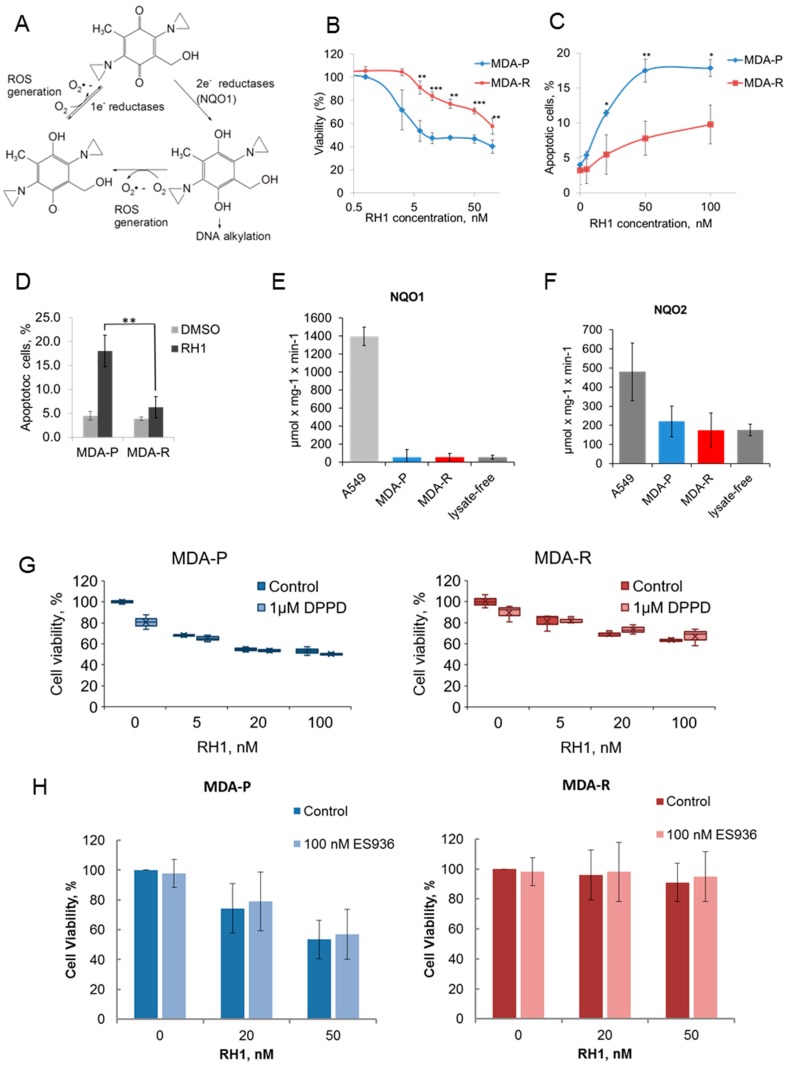
Figure 1.
Characterization of RH1 resistant cells. (A). Molecular mechanism of the prodrug RH1 bioreduction. (B). Viability test. MDA-P and MDA-R cells were treated with increasing concentrations of RH1 for 2 h. Cell survival after 96 h was estimated by MTT assay. Bars are ± SD, significant differences are marked by asterisks: ** p < 0.05, *** p < 0.01, t-test, n = 3. (C). Apoptosis assay. MDA-P and MDA-R cells were exposed to increasing concentrations of RH1 for 2 h and then cultured in drug-free medium for another 48 h. Apoptosis was assayed using acridine orange/ethidium bromide staining. Bars are ± SD, significant differences are marked by asterisks: * p < 0.1, ** p < 0.05, t-test, n = 3. (D). Quantification of flow cytometric nexin-based apoptosis assay. Cells were untreated or treated with 50 nM RH1 for 2 h and stained with Guava Nexin reagent after 48 h. Bars are ± SD, significant difference is marked by asterisks: ** p < 0.05, t-test, n = 3. (E). NQO1 activity assay. The initial rate of RH1 reduction using NADPH cofactor represents NQO1 activity in the cell lysates where cell lysate of A549 cells is acting as a positive control. Bars are ± SD, differences between A549 as a positive control and other samples are significant (p < 0.01), n = 3. (F). NQO2 activity assay. The initial rate of RH1 reduction using NMEH cofactor represents NQO2 activity in the cell lysates. Bars are ± SD, difference between A549 as a positive control and other samples are significant (p < 0.01), n = 3. (G). MDA-P and MDA-R were treated with RH1 in the presence or absence of antioxidant DPPD. Cell survival after 96 h was estimated by MTT assay. Bars are ± SD. (H). MDA-P and MDA-R were treated with RH1 in the presence or absence of NQO1 inhibitor ES936. Cell survival after 96 h was estimated by MTT assay. Bars are ± SD.

