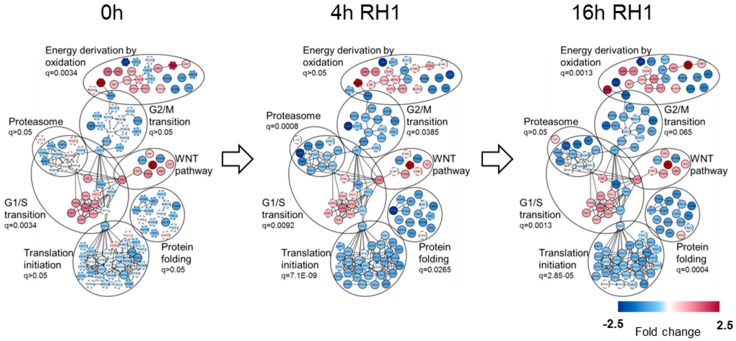
Figure 2.
Functional analysis of global proteome dynamic changes between MDA-P and MDA-R cells. MDA-P and MDA-R cells, untreated or treated with 20 nM RH1 for 2 h followed by 2 or 14 h recovery period (4 and 16 h from the beginning of treatment respectively), were subjected to in-depth quantitative proteomic analysis. Protein differential expression, interaction and functional annotation network was built by means of Cytoscape software with GeneMANIA application. The main functional clusters with enrichment q-value are represented. The color of the nodes demonstrates protein level change in RH1-resistant MDA-R cells.

