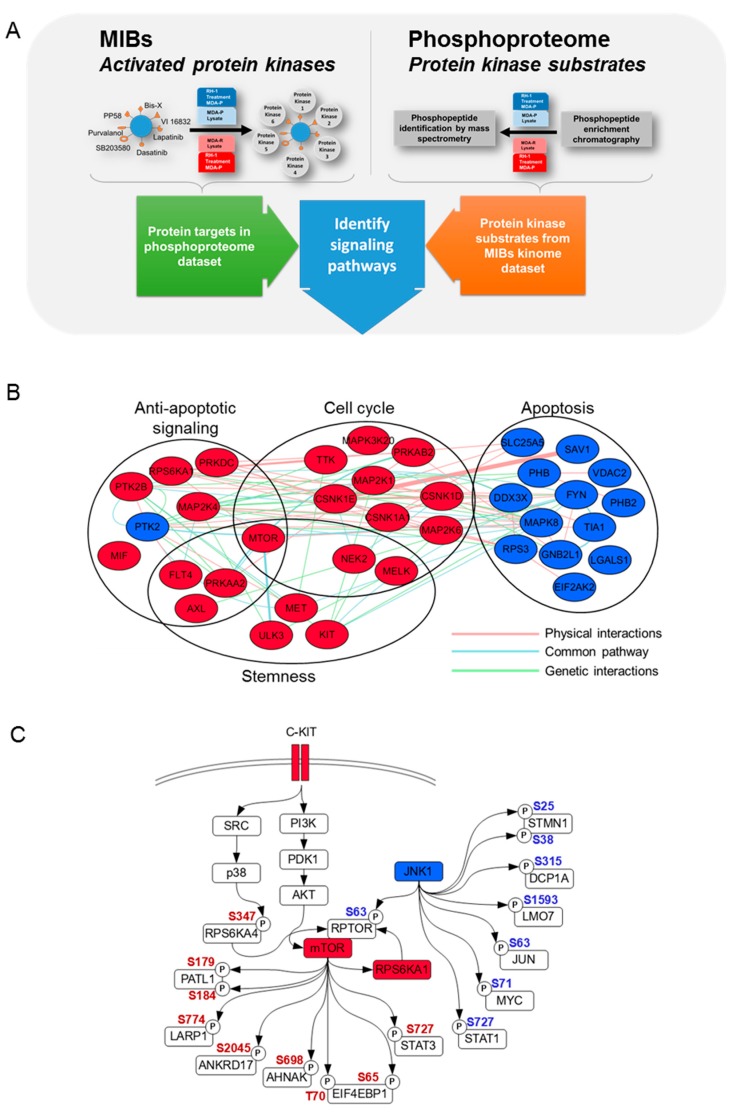
Figure 3.
Protein phosphorylation highlights signaling pathways in RH1-resistant cells. (A). Experimental workflow for kinome and phosphoproteome analysis. (B). MIB analysis of increased and decreased kinase activity between MDA-P and MDA-R cells. MDA-P and MDA-R cells were subjected to MIB analysis, followed by quantitative proteomic analysis. Kinase differential activity, interaction and functional annotation network was built by means of Cytoscape software with GeneMANIA application. The main functional clusters are represented and the color of the nodes demonstrates kinase activity change (red—increased, blue—decreased). (C). JNK1 and c-KIT-AKT-mTOR signaling pathways. Most biologically important pathways were analyzed combining MIB and phosphoproteome datasets. Red node color indicates increased activity of MIB dataset kinases, blue—decreased. Red phosphosite color indicates increased phosphorylation in the phosphoproteome dataset, blue—decreased. AKT and JNK phosphosites were identified by Western blot. Nodes without color indicate proteins that belong to the pathway but have neither been identified nor their phosphorylation changes were observed in either of datasets.

