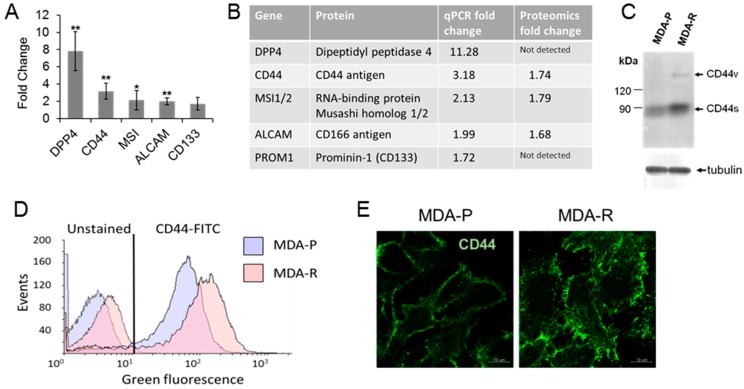
Figure 5.
RH1 resistant cells show an increased level of CSC markers. (A). Relative expression of selected CSC markers measured by RT-qPCR in MDA-R compared to MDA-P. The results are the mean of 3 independent experiments; bars are ± SD (ANOVA; * p < 0.05; ** p < 0.01). (B). Comparison of CSC markers detected by RT-qPCR with quantitative proteomic analysis results. (C). Western blot analysis of various isoforms of CD44 expression in MDA-P and MDA-R cell lines. (D). Flow cytometry aggregated data graph showing autofluorescence and CD44 expression in MDA-P and MDA-R cells. Data combined from unstained and CD44-FITC antibody-stained samples. E. Representative comparative confocal images of CD44 expression in MDA-P and MDA-R cells. Scale bar: 10 µm.

