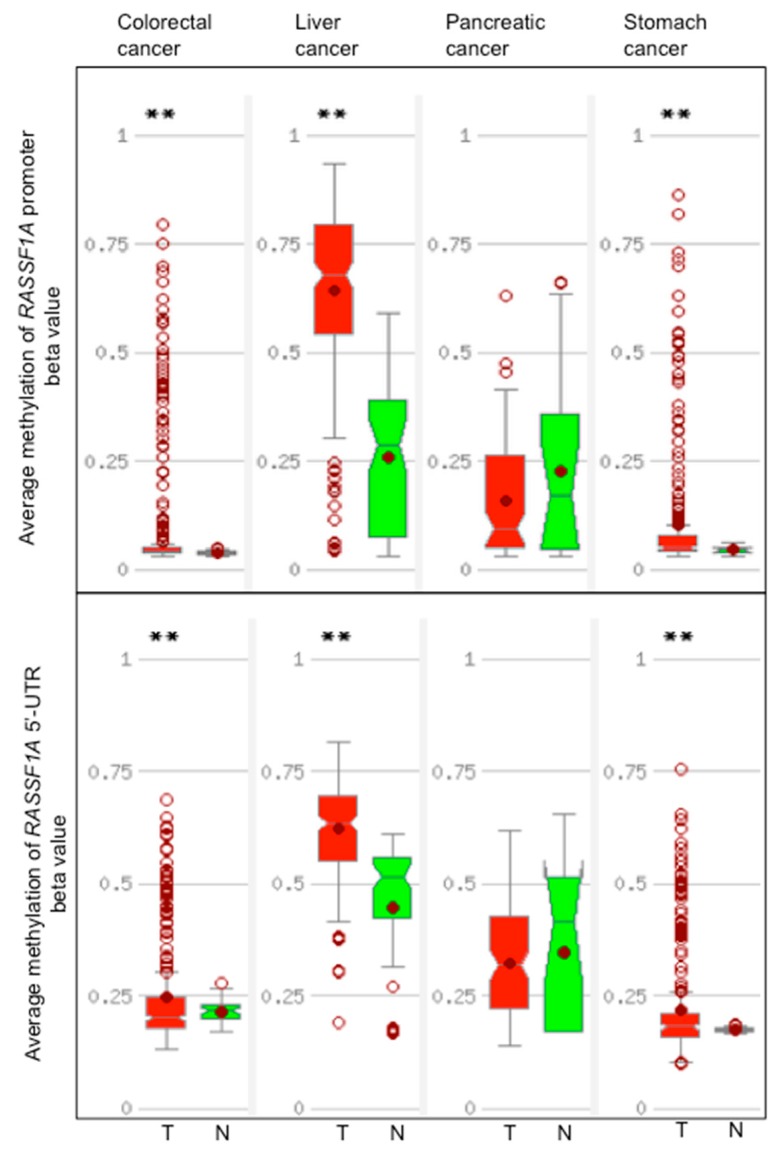
Figure 3.
DNA methylation of the promoter and 5′-UTR of RASSF1A in colorectal, liver, pancreatic, and stomach cancers and in the corresponding normal tissues. Distribution of average methylation in the promoter and 5′-UTR of RASSF1A (NM_007182) in colorectal, liver, pancreatic, and stomach cancers cases. T, tumor tissues (red), N, normal tissue (green). 5′-UTR is the 5′ untranslated region of the first exon of RASSF1A. The promoter region is defined as from 1.5 kb upstream to 0.5 kb downstream of the RASSF1A transcription start site. The graphs show the distribution of beta values calculated as methylated probe intensity divided the unmethylated probe intensity plus methylated probe intensity, plus 100. In the boxes, a horizontal line represents the median and the filled circle the average; the box represents the 25th percentile interval and the whiskers the 95th percentile interval of the distribution. Empty points represent outliers. The double asterisk indicates a significant difference between T and N samples (p < 0.005) calculated by the t-test. The graphs, retrieved from the MethHC site [114], are based on The Cancer Genome Atlas (TCGA) data.

