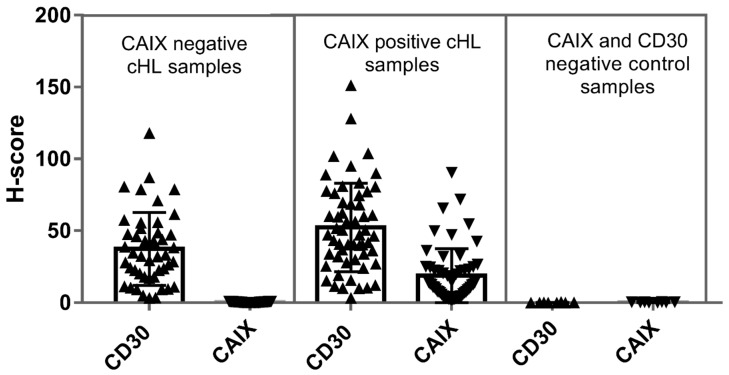
Figure 3.
Distribution and mean values of CD30 and CAIX-related H-scores determined by image analysis. The figure demonstrates the individual H-score values determined for the CAIX-negative (n = 45) and CAIX-positive (n = 56) groups defined by light microscopy. As negative control CD30- and CAIX-double negative nonclonal lymphoproliferations were measured (n = 8). The CD30 H-scores representing the total HRS cell burden proved to be higher in CAIX-positive compared to the CAIX-negative samples according to the Mann–Whitney test (p-value = 0.008, statistically significant).

