Figure 4.
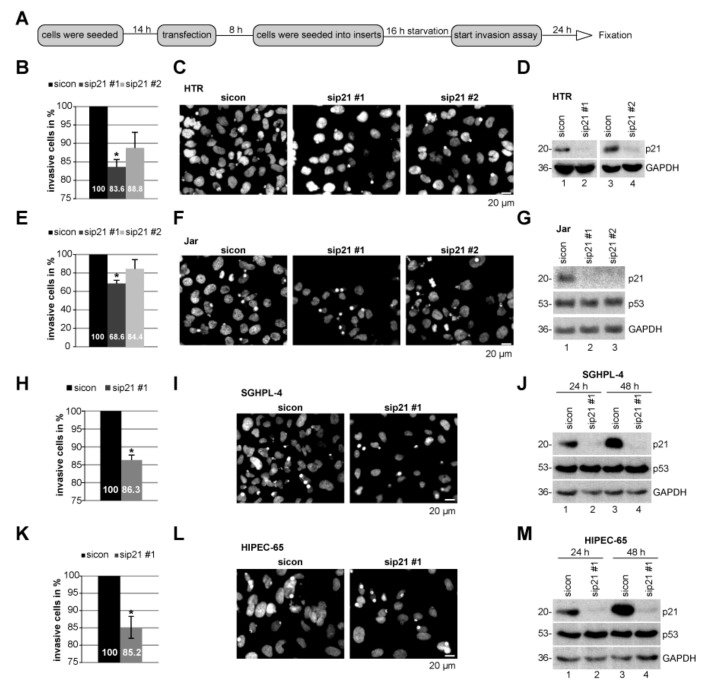
The invasion capacity is impaired in cells with reduced p21 levels. (A) Schedule of invasion assay. Different cell lines were treated with control small interfering RNA (siRNA) (sicon) or two distinct siRNA against p21 (sip21 #1 or #2). (B) Quantification of invaded HTR cells. The total number of invaded cells in the control group was assigned as 100%. (C) Representatives of invaded HTR cells are shown. Scale bar: 20 μm. (D) Control Western blot analysis showing the efficient knockdown of endogenous p21 in HTR cells. Glyceraldehyde-3-phosphate dehydrogenase (GAPDH) served as loading control. (E) Quantification of invaded Jar cells. (F) Representatives of invaded Jar cells are shown. Scale bar: 20 μm. (G) Control Western blot analysis of Jar cells. GAPDH served as loading control. (H) Quantification of invaded SGHPL-4 cells. (I) Representatives of invaded SGHPL-4 cells are shown. Scale bar: 20 μm. (J) Control Western blot analysis of SGHPL-4 cells. GAPDH served as loading control. (K) Quantification of invaded HIPEC-65 cells. (L) Representatives of invaded HIPEC-65 cells. Scale bar: 20 μm. (M) Control Western blot analysis of HIPEC-65 cells. GAPDH served as loading control. The results from each cell line are presented as mean ± standard error of the mean (SEM) from three independent experiments. * p < 0.05.

