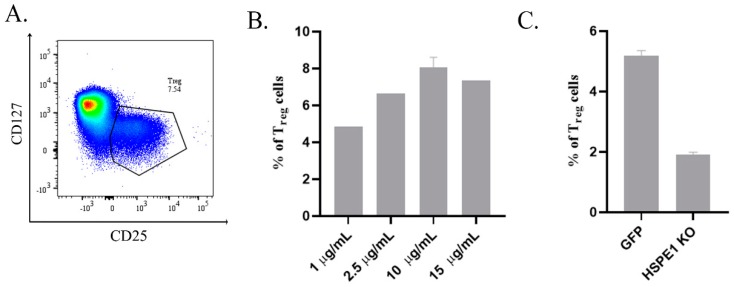
Figure 3.
rHSPE1, BeWo GFP-iEV, and BeWo HSPE1 KO-iEV induced Treg differentiation from CD4+ Th cells. (A) Representative FACS dot plot showing the expanded Treg cell population (defined as CD25+CD127lo) upon rHSPE1 treatment (x-axis showing the expression of CD25, y-axis showing the expression of CD127). (B) Concentration dependent Treg cell expansion upon rHSPE1 treatment. (C) Treg cell expansion upon GFP control transfected-derived iEVs (abbreviated as GFP) and HSPE1 KO-derived iEVs (abbreviated as HSPE1-KO).

