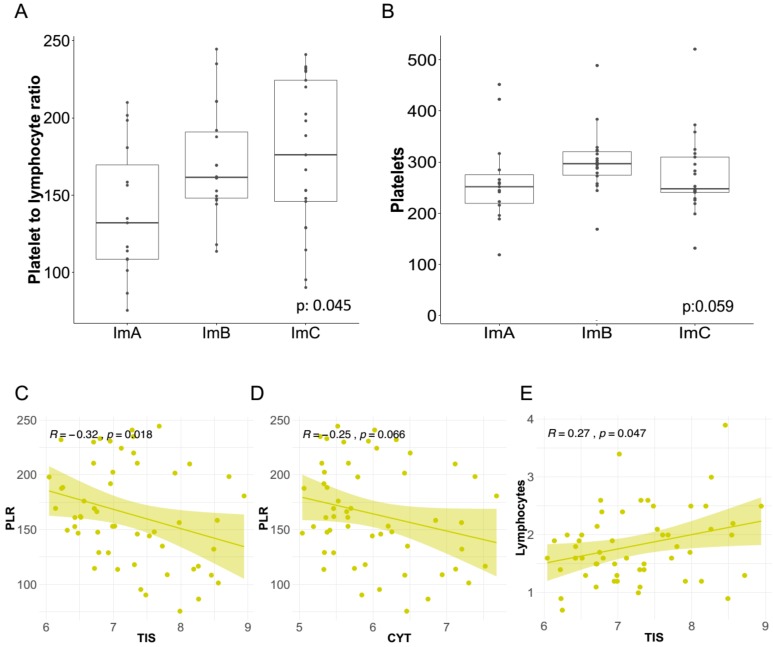
Figure 4.
Correlation of local immune features and the inflammatory systemic blood markers in the triple negative breast cancer cases. Distribution of (A) platelet-to-lymphocyte ratio (PLR) and (B) platelets acquired through blood sample test in the Im-Clus. Scatter plots showing the correlation of: (C) Tumor Inflammation Signature (TIS) vs. PLR, (D) CYT vs. PLR, and (E) TIS vs. lymphocytes. All R coefficients measured by Spearman method. Statistical comparison based on Kruskal-Wallis method.

