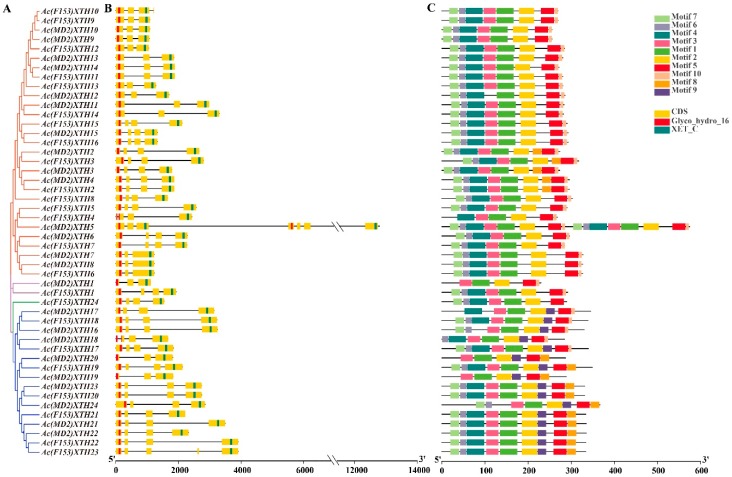
Figure 2.
Phylogenetic relationships, gene structure, and motifs distribution of XTHs. (A) The phylogenetic tree was highlighted by different colors with Group I/II, IIIA, IIIB and Ancestral Group; (B) Gene structure and conserved domains. Yellow boxes and black lines represented exons and introns, respectively. The conserved domains were highlighted by red and blue strips; (C) The motif distribution. Motif1-10 in different colorful boxes.

