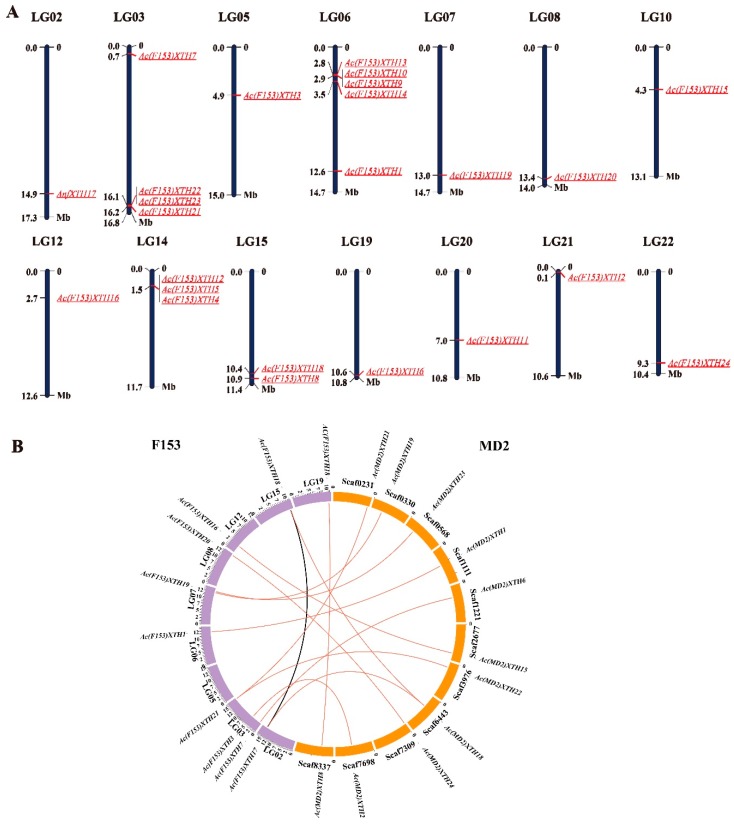
Figure 3.
The chromosome distribution and synteny analysis of XTHs in pineapple. (A) There were 24 Ac(F153)XTHs on each chromosome in ‘F153’. Each pillar represented a chromosome and the scale bar was set in mega base (Mb). The gene names were shown on each chromosome with red; (B) Syntenic relationships among ‘F153’ and ‘MD2’. The links represented different gene replications across cultivars or chromosomes. ‘F153’ marked by the purple arcs and ‘MD2’ marked by the orange arcs.

