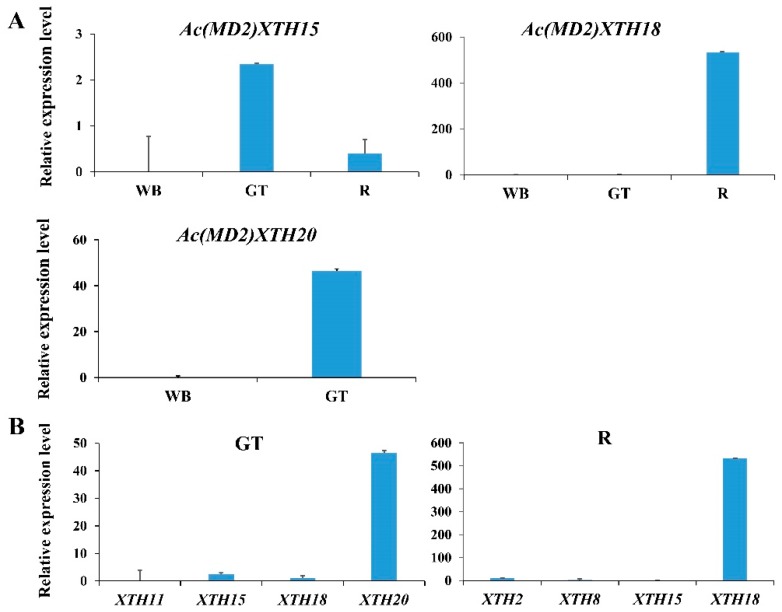
Figure 5.
The relative expression level in different tissues of ‘MD2’ by RT-qPCR. WB, GT, and R represented white leaf base, the green leaf tip, and root, respectively. (A) The expression levels in the green leaf tip, white leaf base, and (or) root; (B) Expression levels of several Ac(MD2)XTH genes in the green leaf tip and root.

