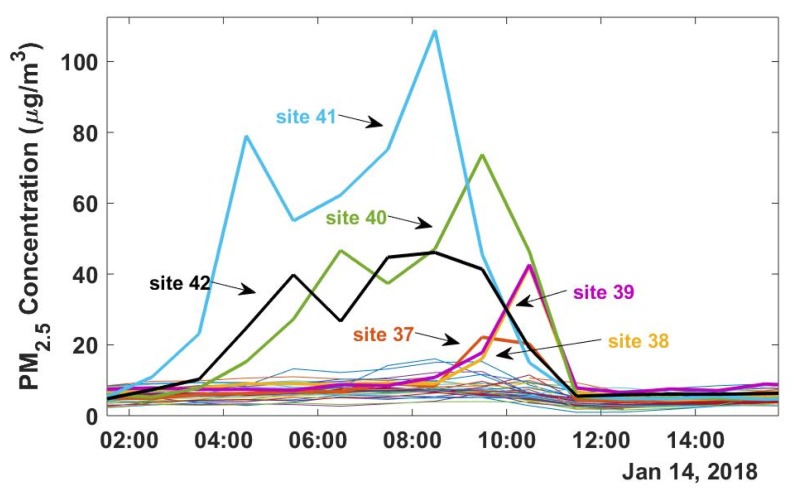
Figure 2.
Example of a high PM2.5 event associated with local emissions. This figure is exemplary of periods of time throughout the study period when sites surrounding the Coke plant (indicated by thick lines) experienced elevated PM2.5 concentrations due to plant emissions while all other sites (thin lines) maintained background PM2.5 concentrations.

