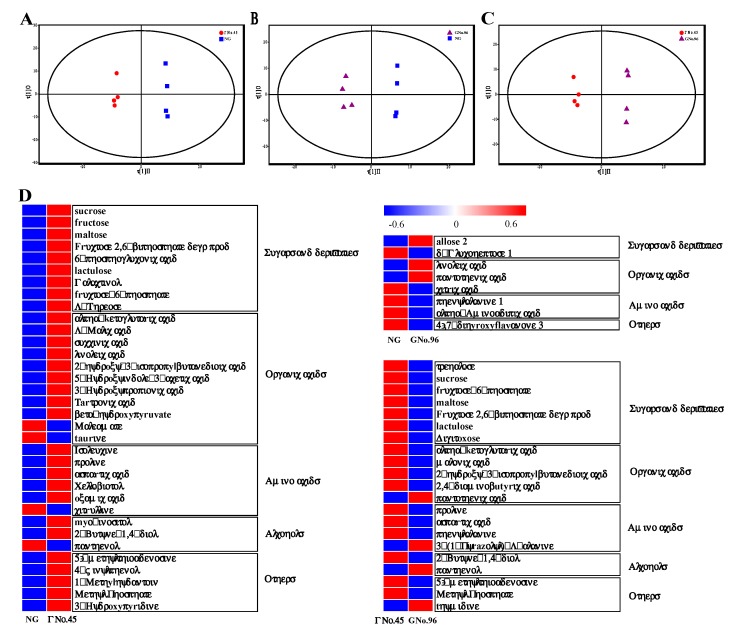
Figure 3.
(A) OPLS-DA score plots generated from OPLS-DA models and different metabolites (DMs) in the cucumber fruit of NG, GNo.96, and GNo.45. (B) OPLS score plots (R2Y = 0.98; Q2 = 0.35). OPLS score plots (R2Y = 0.98; Q2 = 0.12). (C) OPLS score plots (R2Y = 0.98; Q2 = 0.27). (D) Heat maps of the contents of DMs in sugars and derivatives, organic acids, amino acids, alcohols, and others in fruits of NG, GNo.96, and GNo.45.

