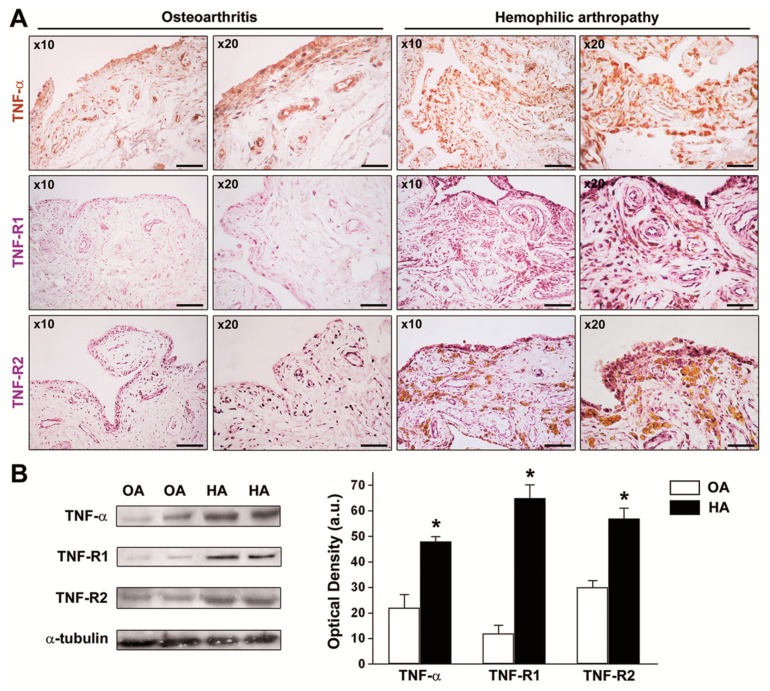
Figure 3.
Expression of tumor necrosis factor (TNF)-α, TNF receptor 1 (TNF-R1), and TNF receptor 2 (TNF-R2) in synovial tissue from patients with hemophilic arthropathy (HA) and osteoarthritis (OA). (A) Representative microphotographs of tissue sections subjected to immunoperoxidase-based immunohistochemical staining for TNF-α (brown color), TNF-R1, and TNF-R2 (purple color) are shown. TNF-α, TNF-R1, and TNF-R2 immunostaining is strongly increased either in the hyperplastic lining or in the sublining layers of the HA synovium compared to non-inflamed OA control synovium. Original magnification: ×10 and ×20. Scale bar: 200 µm (×10 panels), 100 µm (×20 panels). (B) Western blotting of total protein extracts from the synovium of HA patients (n = 10) and OA controls (n = 8). Representative immunoblots for TNF-α, TNF-R1, and TNF-R2 are shown. The densitometric analysis of the bands normalized to α-tubulin is reported in the histograms. Data are the mean ± SEM of the optical density in arbitrary units (a.u.). * p < 0.05 vs. OA (Student’s t-test).

