Figure 3.
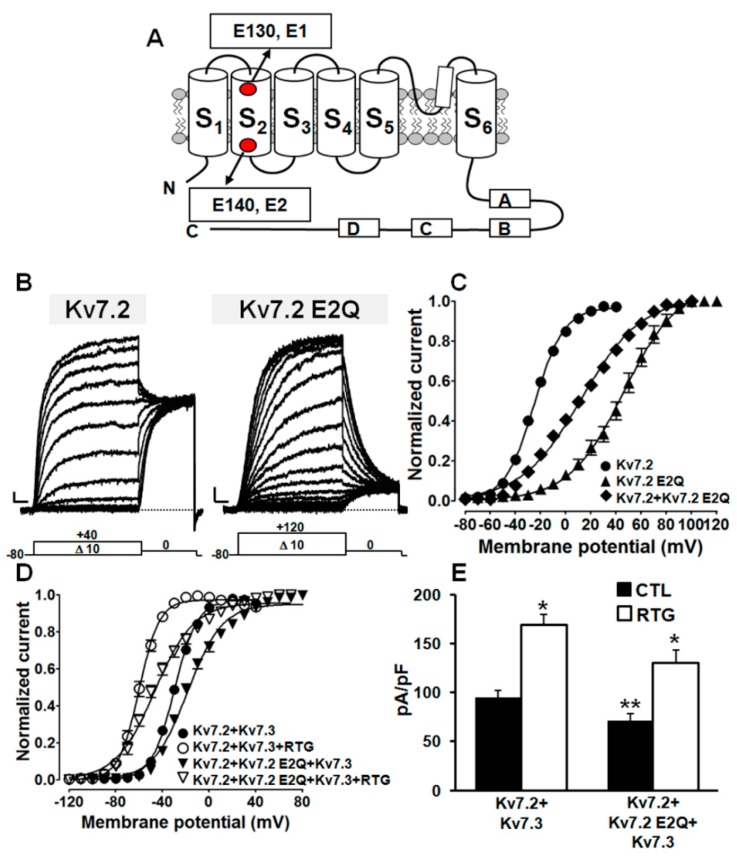
Functional characterization of channels incorporating Kv7.2 E2Q subunits. (A) Topology of a single Kv7.2 subunit, showing the localization of the E130 (E1) and E140 (E2) residues; “S1” to “S6” indicate transmembrane segments. Boxes labelled with “A”, “B”, “C”, and “D” indicate C-terminal α-helical domains. Representative current traces (B) and conductance/voltage (G/V) curves obtained (C) from CHO cells expressing the indicated channels. The voltage protocol used for these experiments is shown below the traces. Current scale: 100 pA; time scale: 200 ms. G/V curves (D) and current densities (E) measured for the indicated channels in control conditions (CTL; filled bars) or upon perfusion of 10 μM Retigabine (RTG; empty bars). A single asterisk indicates values showing statistically significant differences (p < 0.05) from the respective control; a double asterisk indicates a value showing a statistically significant difference (p < 0.05) between Kv7.2+Kv7.3 and Kv7.2+Kv7.2 E2Q+Kv7.3 channels.

