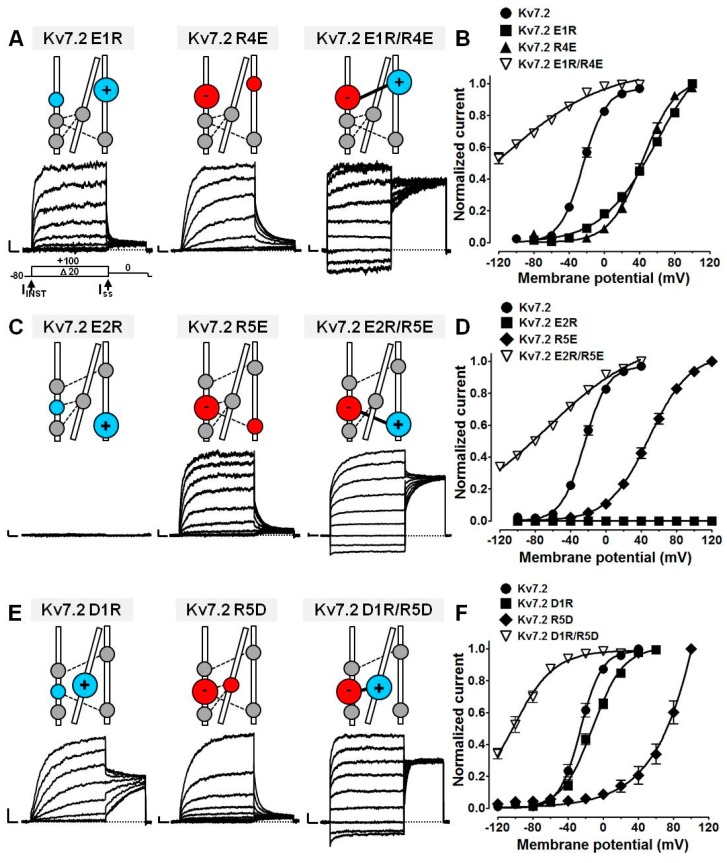
Figure 5.
Functional testing of E1/R4, E2/R5, D1/R5 interactions by charge mutagenesis. Representative current traces (A,C,E) and G/V relationships (B,D,F) for the indicated channels expressed in CHO cells. Current scale: 500 pA; time scale: 200 ms. The residues indicated in coloured symbols of larger size in the schematic drawings above panels A, C, and E highlight those where mutations have been engineered. Blue indicates positively charged residues; red indicates negatively charged residues.

