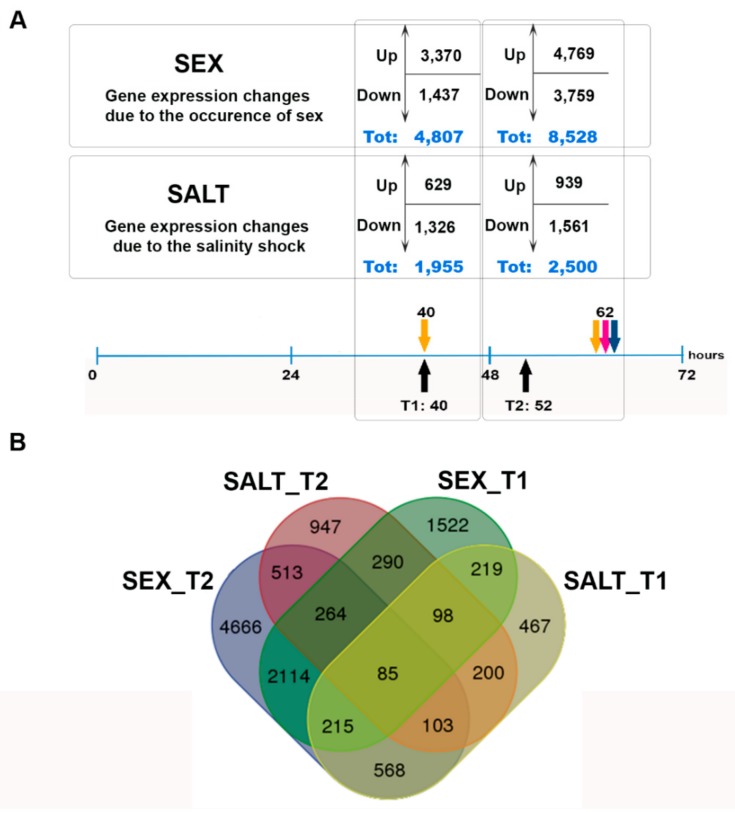
Figure 3.
Number of genes differentially expressed in the SEX and SALT comparisons: (A) Number of genes up- and downregulated at the two time points. (B) Venn diagram showing the overlap between different datasets of differentially expressed genes in the SEX and SALT conditions at the two time points.

