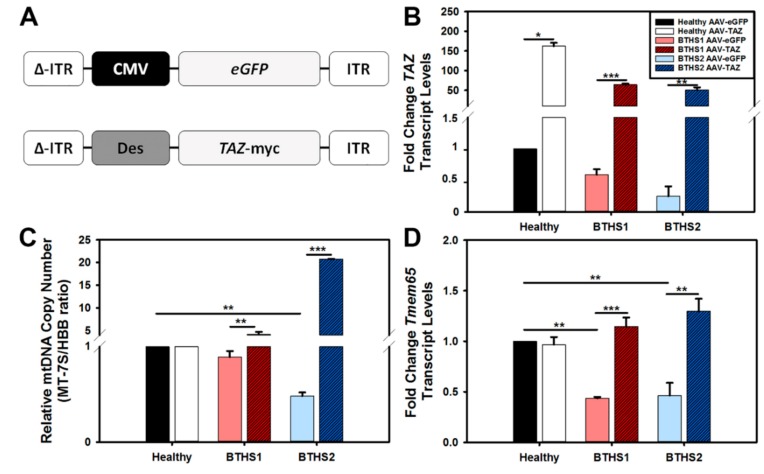
Figure 2.
Vector design, TAZ gene expression, and mtDNA copy numbers – (A) Diagrams of the GFP marker gene control (top) and human TAZ containing AAV vectors used in this study. ΔITR on the left represents the double-stranded version of AAV inverse terminal repeats. (B) TAZ gene expression assay results demonstrate dramatic fold increase in expression over baseline for AAV-TAZ-treated cells. (C) Relative mtDNA copy numbers in BTHS lines following AAV-eGFP (control vector—light filled bars) or AAV-TAZ treatment (dark hashed bars) as compared to respective healthy control levels. (D) TMEM65 gene expression results demonstrate significant increases in BTHS lines following AAV-TAZ gene delivery. TAZ and TMEM65 gene expression levels were normalized to 18S expression for all samples. (Data are presented as mean + std. err. * p ≤ 0.05, ** p ≤ 0.01, *** p ≤ 0.001.)

