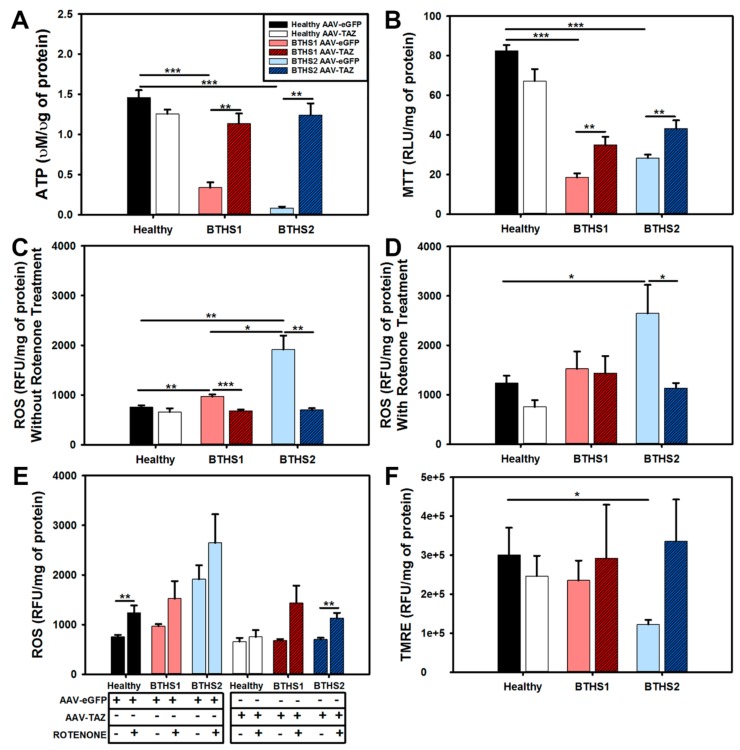
Figure 4.
Mitochondrial function assays following AAV-TAZ treatment: (A) ATP generation, (B) MTT levels, (C) ROS levels, (D) ROS levels (intracellular ROS derived from superoxide O2−) following addition of rotenone. (E) Information from (C) and (D) combined into one graph, and (F) TMRE (mitochondrial membrane potential levels) relative fluorescence levels from cells following administration of control AAV-eGFP (light filled bars) and AAV-TAZ (dark hashed bars) vectors. (Data are presented as mean + std. err. * p ≤ 0.05, ** p ≤ 0.01, *** p ≤ 0.001.)

