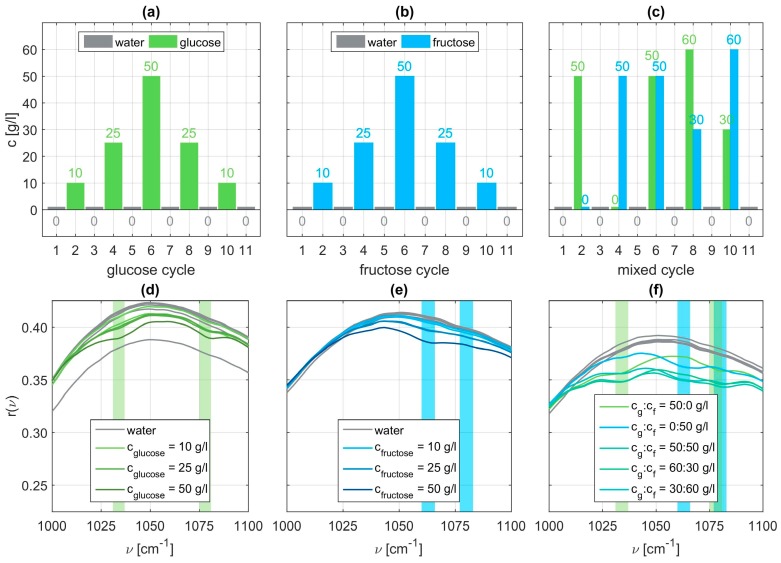
Figure 3.
Employed measurement cycles with different concentrations of glucose (a), fructose (b), or both (c). Panels (d) to (f) show the corresponding relative reflectance of each of the eleven SEIRA measurement sets with the expected fingerprint region for molecular vibrations of glucose and fructose highlighted in light green or light blue, respectively.

