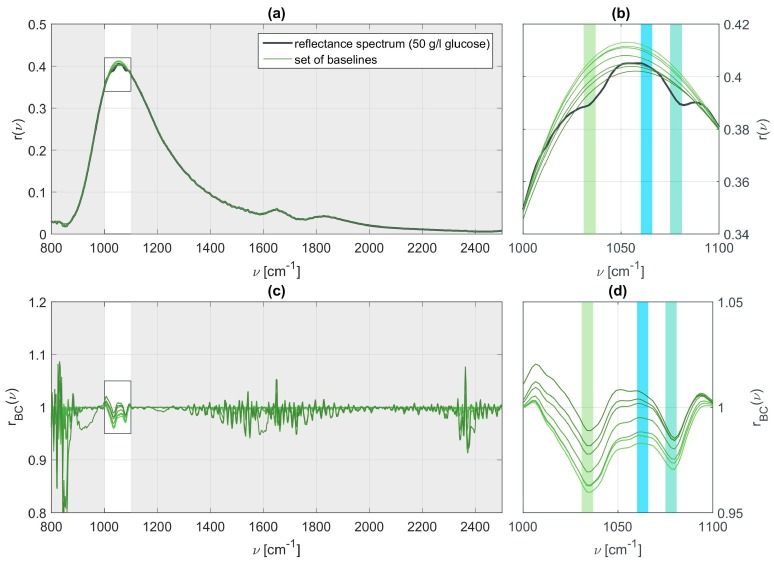
Figure 4.
(a) Relative reflectance measured for 50 g/l aqueous glucose together with a set of baselines for varying parameters ; (b) Zoom in on the relevant range of wavenumbers at which vibrational resonances are expected to appear for glucose and fructose; (c,d) Baseline corrected signals and the influence of on the vibrational features.

