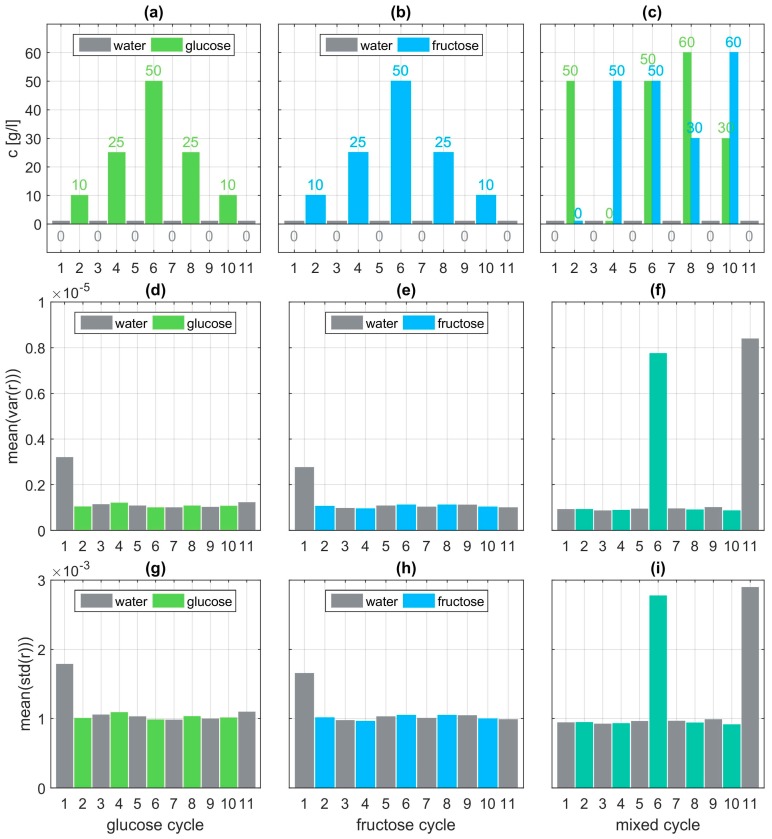
Figure A2.
Statistical analysis of the measurement sets for each of the three cycles. The glucose/fructose concentration for each set is depicted in panels (a–c). The corresponding mean value of the variance within the fingerprint region ranging from 1000–1100 cm−1 (compare to panel (d) of Figure A1) is visualized in panels (d–f). The corresponding mean value of the standard deviation is depicted in panels (g–i).

