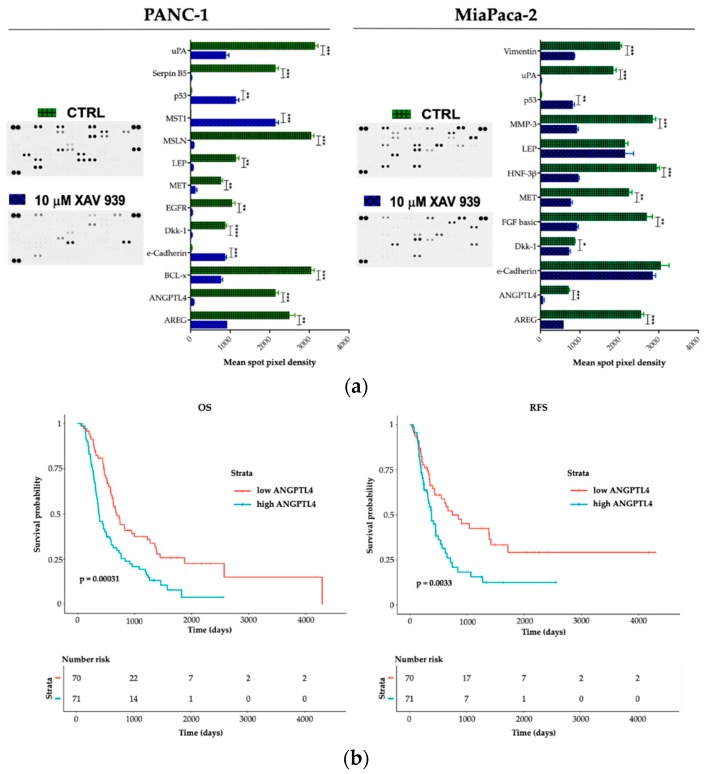
Figure 10.
(a) A human XL oncology array of 84 human cancer-related protein was performed on PANC-1 and MIAPaCa-2 CM before and after treatment with XAV-939 (10 µM) for 48 h. Array spots were analyzed with ImageJ Lab 1.51 Software and normalized to positive control signal intensities. Graph bars represent the pixel density of the detected cancer-related proteins in two independent experiments. Values are expressed as mean ±SD of ten independent experiments. * p < 0.05; ** p < 0.05; and *** p < 0.001; **** p < 0.0001, versus control. (b) Survival function of ANGPTL4high versus ANGPTL4low PDAC patients.

