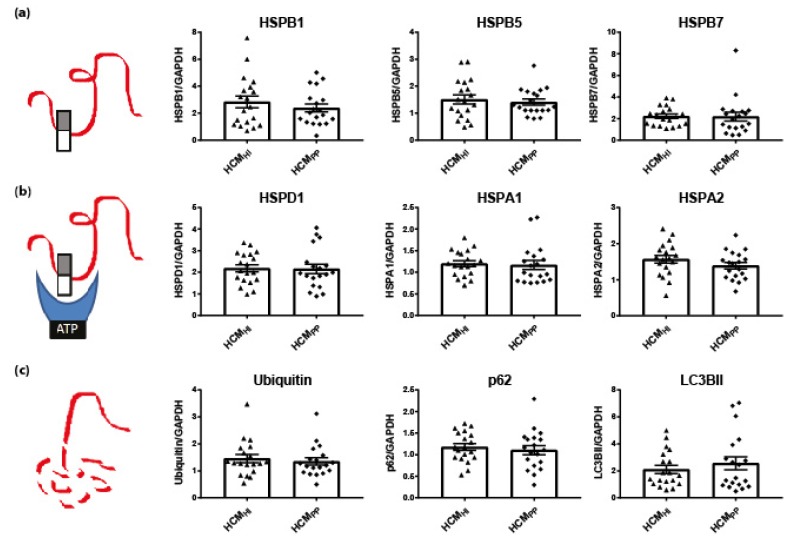
Figure 5.
Pathomechanism of HCM and key PQC players. (a) Stabilizing HSPs (HSPB1, HSPB5, HSPB7), (b) HSPs with refolding capacity (HSPD1, HSPA1 HSPA2) and (c) degradation markers (ubiquitin, p62, LC3BII) were not significantly different between HCMHI (n = 19) and HCMPP (n = 19). Each dot in the scatter plots represents an individual sample. Figure reproduced and adapted with permission from Dorsch, L.M. et al., Pflügers Archiv–European Journal of Physiology; published by Springer Berlin Heidelberg, 2018.

